-
Method of Manufactured Solutions for Compressible Navier-Stokes
2D Zero Pressure Gradient Flat Plate RANS Verification Case
2D Bump-in-Channel RANS Verification Case
Three-Element High-Lift Subsonic Airfoil
Shock-Wave Boundary-Layer Interaction
Langtry and Menter transition model
2D DSMA661 Airfoil Near-Wake RANS Verification Case
Three-Element High-Lift Subsonic Airfoil
| Solver | Version | Author |
|---|---|---|
RANS |
7.3.0 | P. Gomes |
The details of the 30P30N validation case are taken from the Fourth Aerodynamics Prediction Challenge (APC-IV) website.
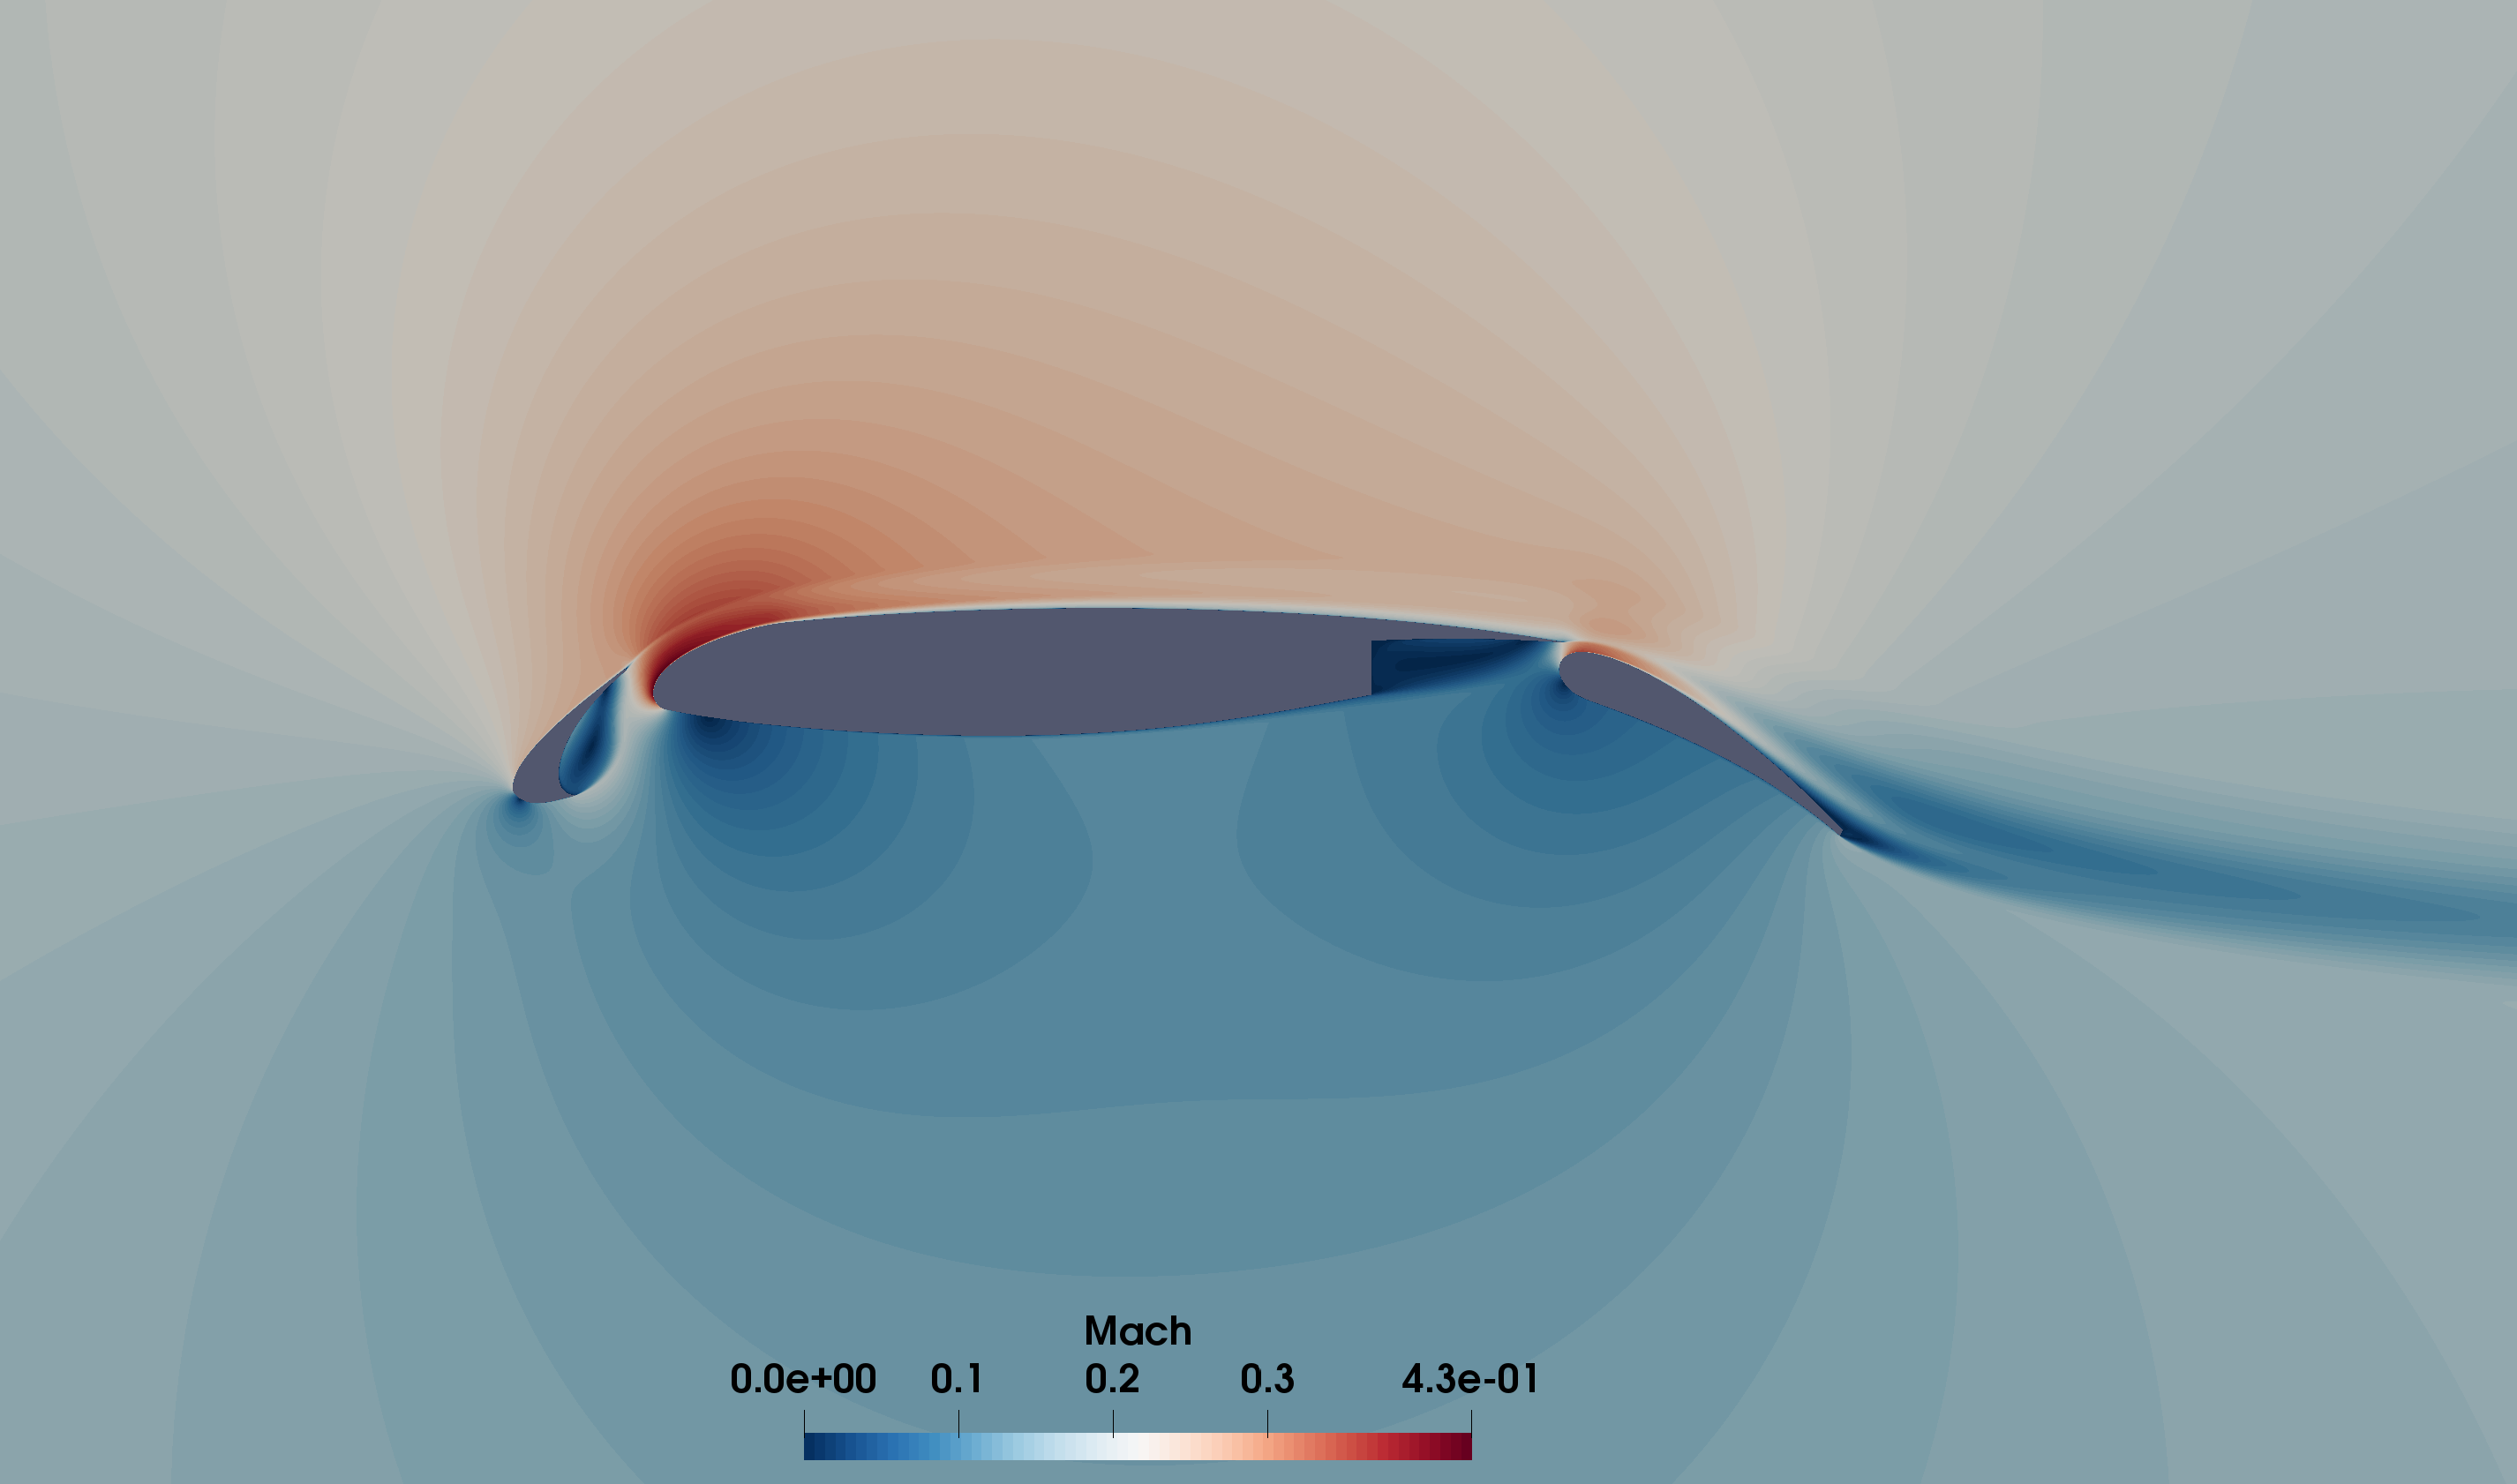
Figure 1 - Mach number contours at 5.5deg AoA.
By comparing the SU2 results against other codes on a sequence of grids we can verify the implementation of the SA turbulence model. Furthermore, we compare the results obtained with two common convective methods (Roe and JST) to study their characteristics and suitability for this type of application (high-lift, subsonic).
Problem Setup
The flow conditions are according to the APC-IV specifications, in summary, Mach 0.17 and Re 1.71e6. The SU2 configuration file used in this study is available here. SU2 was run with “freestream equal Mach” non-dimensionalization for all configurations. The SA-noft2 turbulence model was used with first order advection, the convective methods used for the NS equations are described later.
Mesh Description
Structured meshes of increasing density are used to perform a grid convergence study. The meshes are 2D SU2 versions of the publicly available 2.5D APC-IV JAXA grids. The SU2 versions can be downloaded from the SU2 V&V GitHub repository. The mesh designations and approximate sizes are:
- L1 “coarse” (2 x “fine”) - 64k quadrilaterals
- L2 “medium” (1.5 x “fine”) - 113k quadrilaterals
- L3 “fine” - 261k quadrilaterals
- L4 “extra-fine” (“fine” / 1.5) - 585k quadrilaterals
- L5 “super-fine” (“fine” / 2) - 1M quadrilaterals
Note: The original meshes use US length units (in) whereas the converted SU2 meshes use SI units (m).
Results
First, we obtain results at low angle-of-attack (5.5 degrees) for different solver configurations. Then we study the behavior of two configurations around the maximum lift point on the “fine” grid level. Finally we analyze the differences between solver configurations.
Grid convergence
The main configuration studied here is the Roe scheme, with MUSCL reconstruction using Green-Gauss gradients, and limited using the van Albada edge-based limiter. The only possible tunning parameter of this configuration is the entropy fix coefficient, which was fixed at 1e-5. We compare this configuration with the JST scheme on three grid levels (with 2nd and 4th order coefficient values of 0.5 and 0.01, respectively). For completeness, we also test the effect of the limiter on the “fine” level by using the Venkatakrishnan limiter with coefficient 0.05.
We observe second order convergence of the lift and drag coefficients, and good agreement between Roe + van Albada, JST, FaSTAR results, and Cflow results. The Roe + Venkatakrishnan configuration predicts lower values, which were observed to be sensitive to the limiter coefficient. For example lowering it to 0.025 increases drag to the level obtained with the other two configurations.
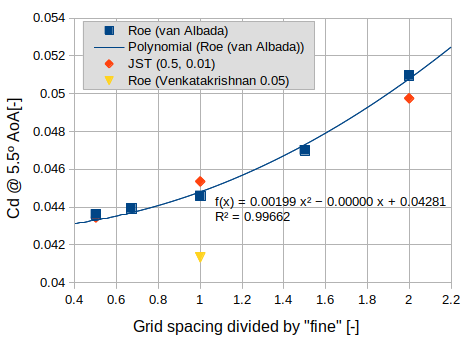
Figure 2 - Drag coefficient at 5.5deg AoA.
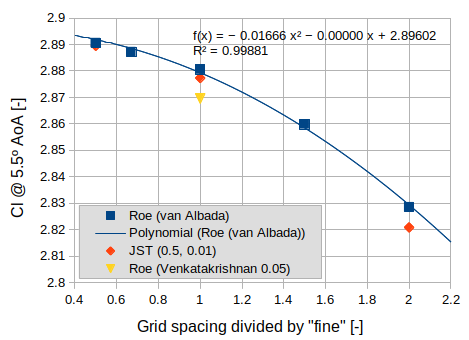
Figure 3 - Lift coefficient at 5.5deg AoA.
Maximum lift
Roe + van Albada and JST agree well on the maximum lift, and again match the results of other codes. However JST predicts the flow to remain attached at significantly higher angle-of-attack than expected.
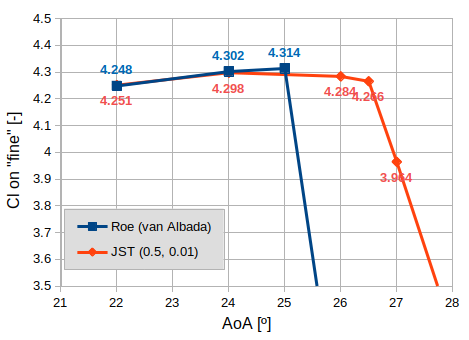
Figure 4 - Lift coefficient on the fine grid level.
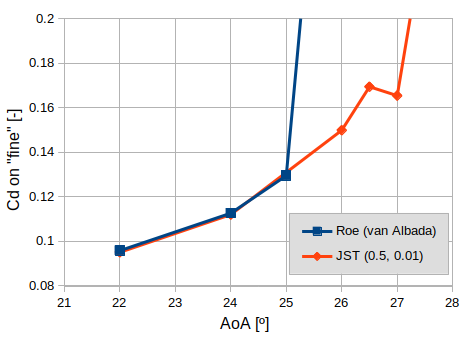
Figure 5 - Drag coefficient on the fine grid level.
Discussion
The pressure coefficient distributions at 5.5 degrees AoA computed by Roe + van Albada and JST are nearly identical. However, JST predicts significantly higher skin friction coefficient (Cf) on the suction side which explains the higher angle-of-attack required for leading-edge separation to occur. Away from this critical point the lift and drag characteristics are dominated by the pressure distribution and thus the two schemes agree well. The only significant differences in Cf between the van Albada and Venkatakrishnan limiters are at the trailing-edges.
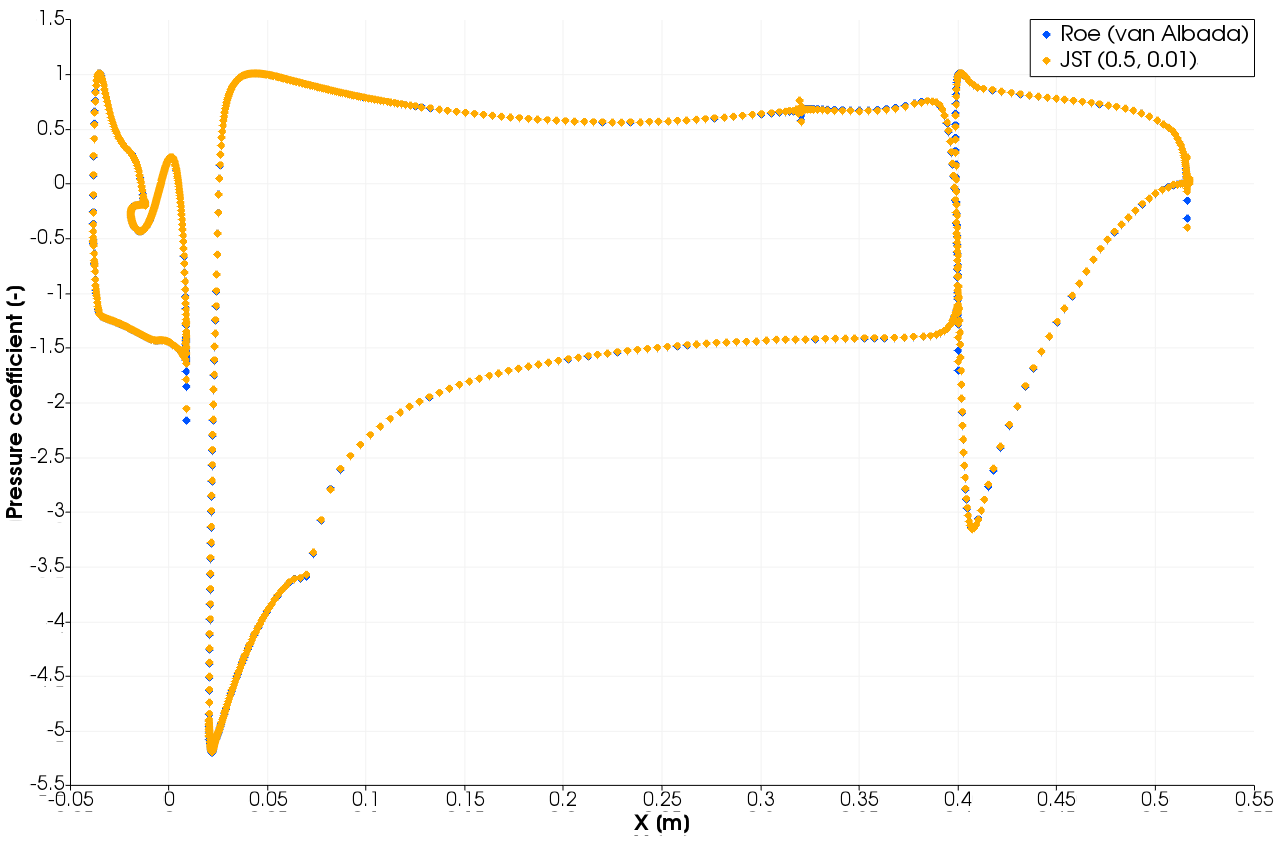
Figure 6 - Pressure coefficient distribution at 5.5deg AoA on fine grid level.
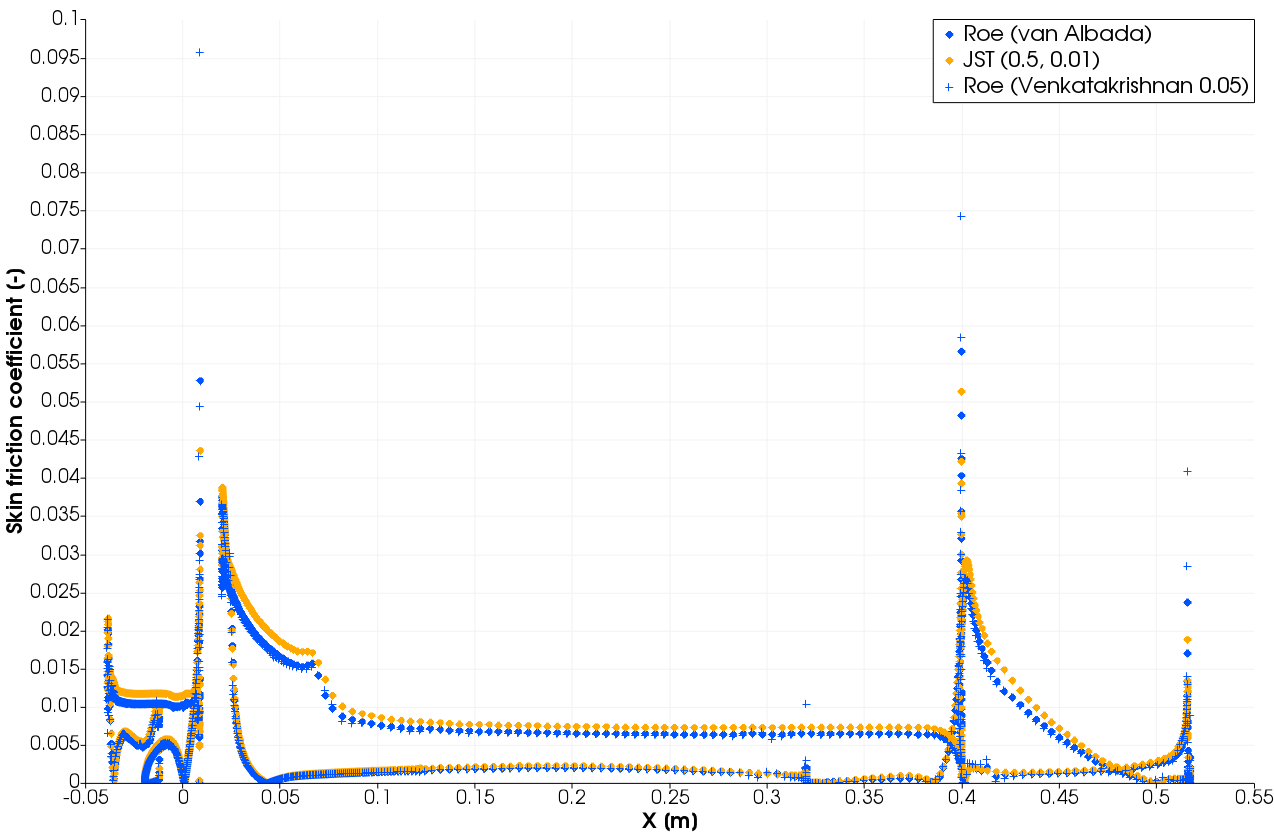
Figure 7 - Skin friction coefficient distribution at 5.5deg AoA on fine grid level.