-
Method of Manufactured Solutions for Compressible Navier-Stokes
2D Zero Pressure Gradient Flat Plate RANS Verification Case
2D Bump-in-Channel RANS Verification Case
Three-Element High-Lift Subsonic Airfoil
Shock-Wave Boundary-Layer Interaction
Langtry and Menter transition model
2D DSMA661 Airfoil Near-Wake RANS Verification Case
Langtry and Menter transition model
| Solver | Version | Author |
|---|---|---|
RANS |
7.4.0 | S. Kang |
The details of the Langtry and Menter(LM) transition model validation cases are taken from the AIAA Transition modeling workshop-I. To validate the LM model, the simulation results of SU2 are compared with the results of Fluent19.0 with a similar numerical setting.
Problem Setup
Flow conditions are the reference from : https://doi.org/10.2514/6.2022-3679 and AIAA Transition modeling workshop-I.
| Case | T3A | T3B | T3Am | NLF0416 | E387 |
|---|---|---|---|---|---|
| Inlet Velocity (m/s) | 69.44 | 69.44 | 19.8 | 34.72 | 20.42 |
| Density (kg/m^3) | 0.053 | 0.053 | 1.2 | 2.13 | 0.175 |
| Viscosity (kg/ms) | 1.85E-5 | 1.85E-5 | 1.79E-5 | Sutherland’s Law | Sutherland’s Law |
| Freestream Temperature (K) | 300 | 300 | 300 | 300 | 288.15 |
| Unit Reynolds number (1/m) | 2.0E5 | 2.0E5 | 1.328E6 | 4.0E6 | 2.0E5 |
| Mach Number | 0.2 | 0.2 | 0.058 | 0.1 | 0.06 |
| AoA | 0.0 | 0.0 | 0.0 | 0.0 | 0,2,4,6 |
| Viscosity Ratio | 11.9 | 99.0 | 9.0 | 1.0 | 1.0 |
| Freestream Turbulence Intensity (%) | 5.855 | 7.216 | 1.0 | 0.15 | 0.001 |
| Turbulence Problem | SST | SST | SST | SST | SA/SST |
Mesh Description
The grids of T3A, T3B, and NLF cases are provided by TMW(Transition Model Workshop). The grid of T3Am was made with reference to https://doi.org/10.2514/6.2022-3679. At the moment, no mesh convergence study has been performed on E387 case. The grid of Eppler E387 was made with reference to https://doi.org/10.1177/0954406217743537. If you want to run the above cases (Flat plate), you can use only the fine-level grid files available in the SU2 V&V repository. If you want to run the E387 test case you can use the mesh file available in the SU2 V&V repository
Numerical Scheme
| Flat plate | Fluent | SU2 |
|---|---|---|
| Flux | Roe-FDS | L2ROE |
| Gradient | Least Squares Cell Based | WEIGHTED_LEAST_SQUARES |
| Spatial Discretization Flow | Third-order MUSCL | MUSCL_FLOW |
| Spatial Discretization Turbulence | Third-order MUSCL | MUSCL_YES |
| NLF0416 | Fluent | SU2 |
|---|---|---|
| Flux | Roe-FDS | L2ROE |
| Gradient | Least Squares Cell Based | WEIGHTED_LEAST_SQUARES |
| Spatial Discretization Flow | second-order Upwind | MUSCL_FLOW |
| Spatial Discretization Turbulence | second-order Upwind | MUSCL_YES |
| E387 | SU2 |
|---|---|
| Flux | L2ROE/ROE |
| Gradient | WEIGHTED_LEAST_SQUARES |
| Spatial Discretization Flow | MUSCL_FLOW |
| Spatial Discretization Turbulence | UPWIND |
Results
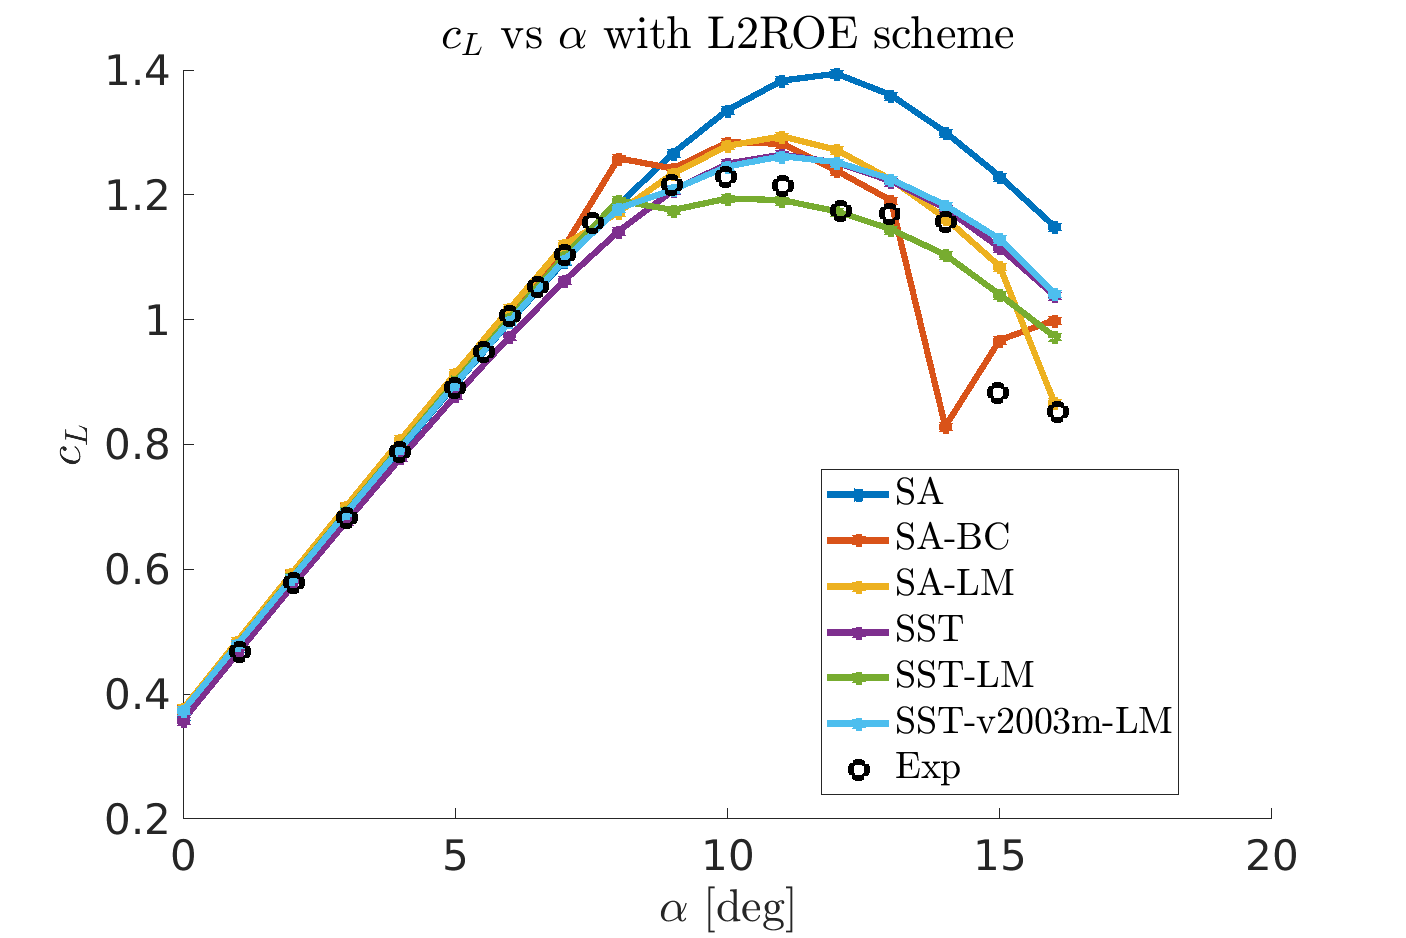
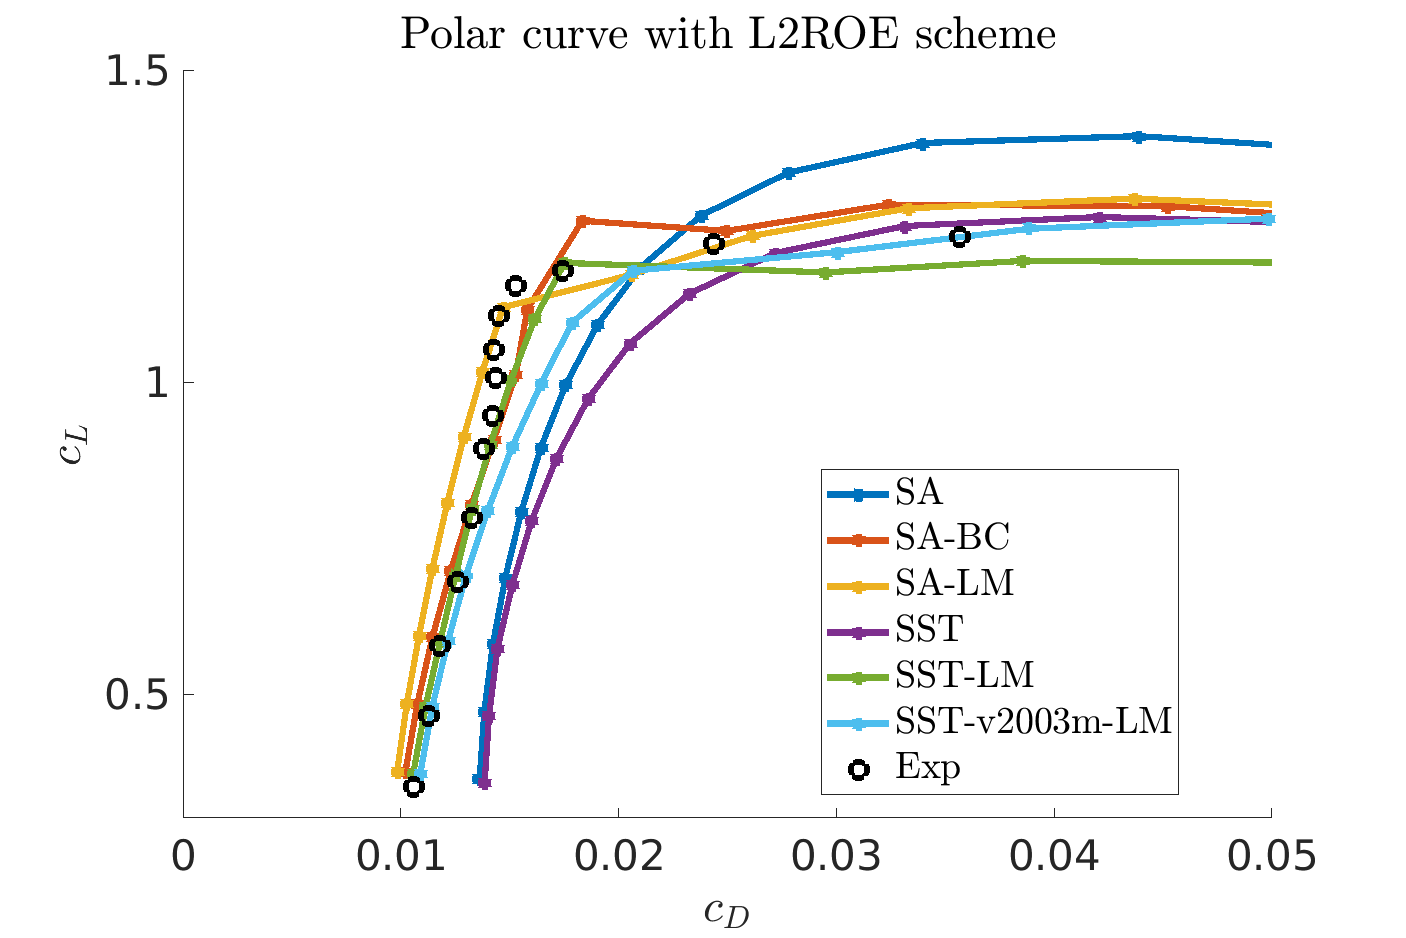
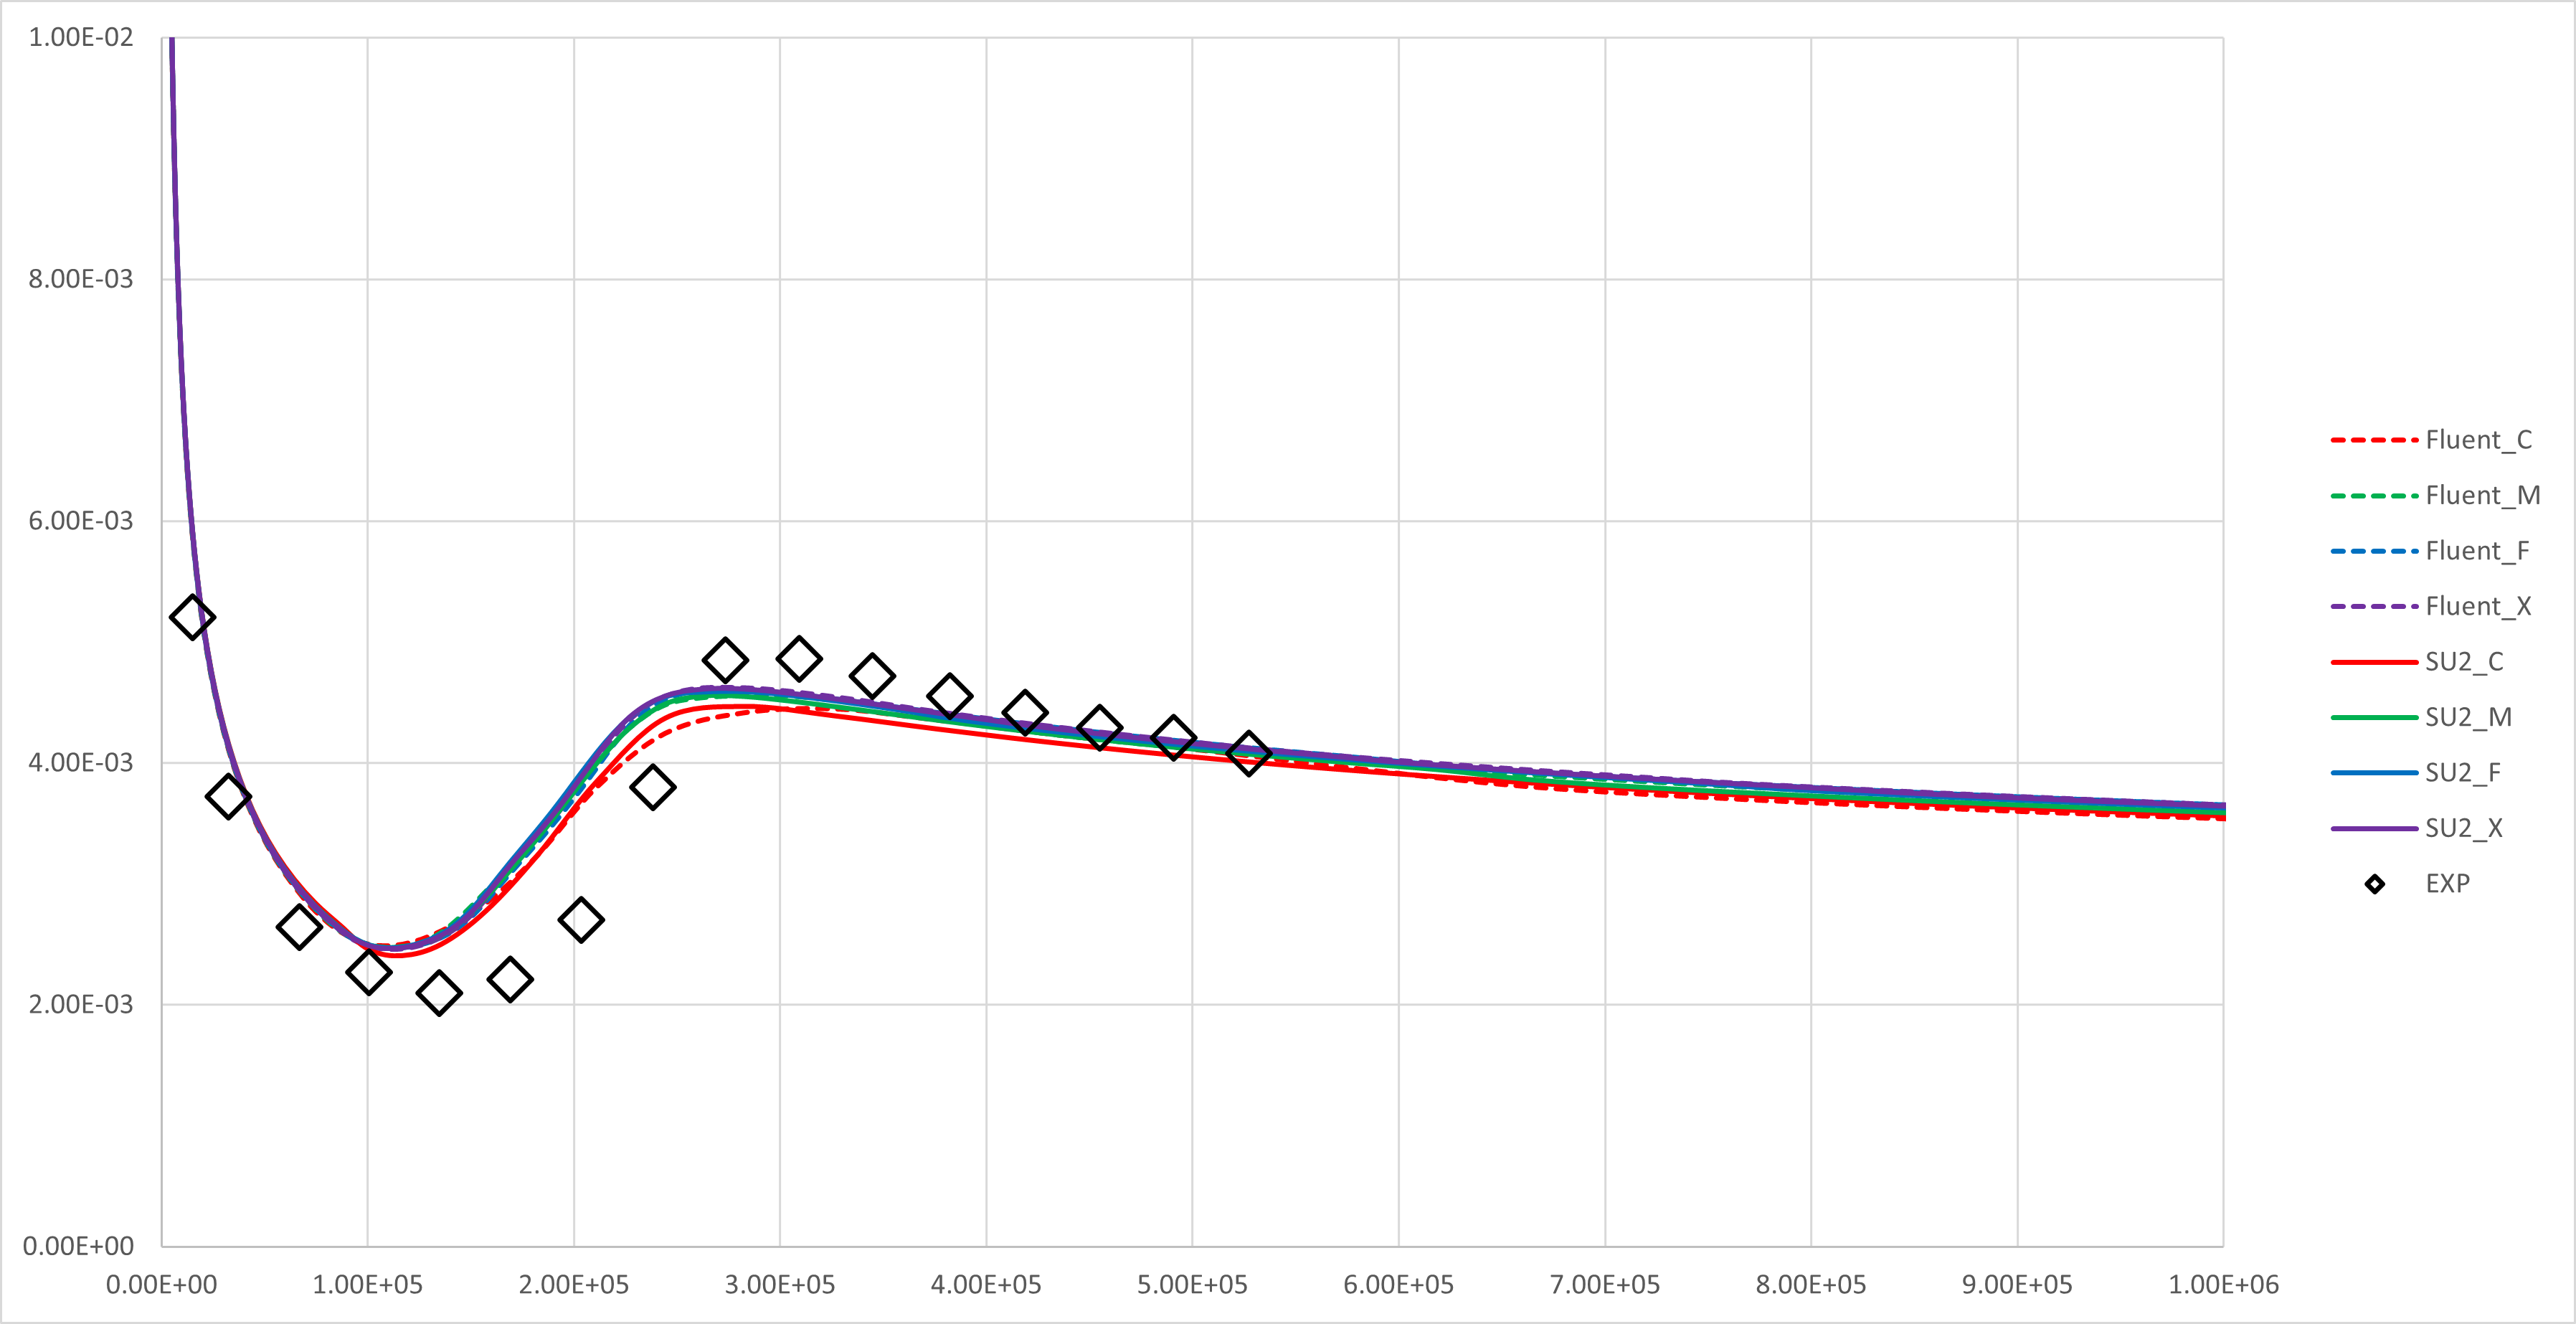
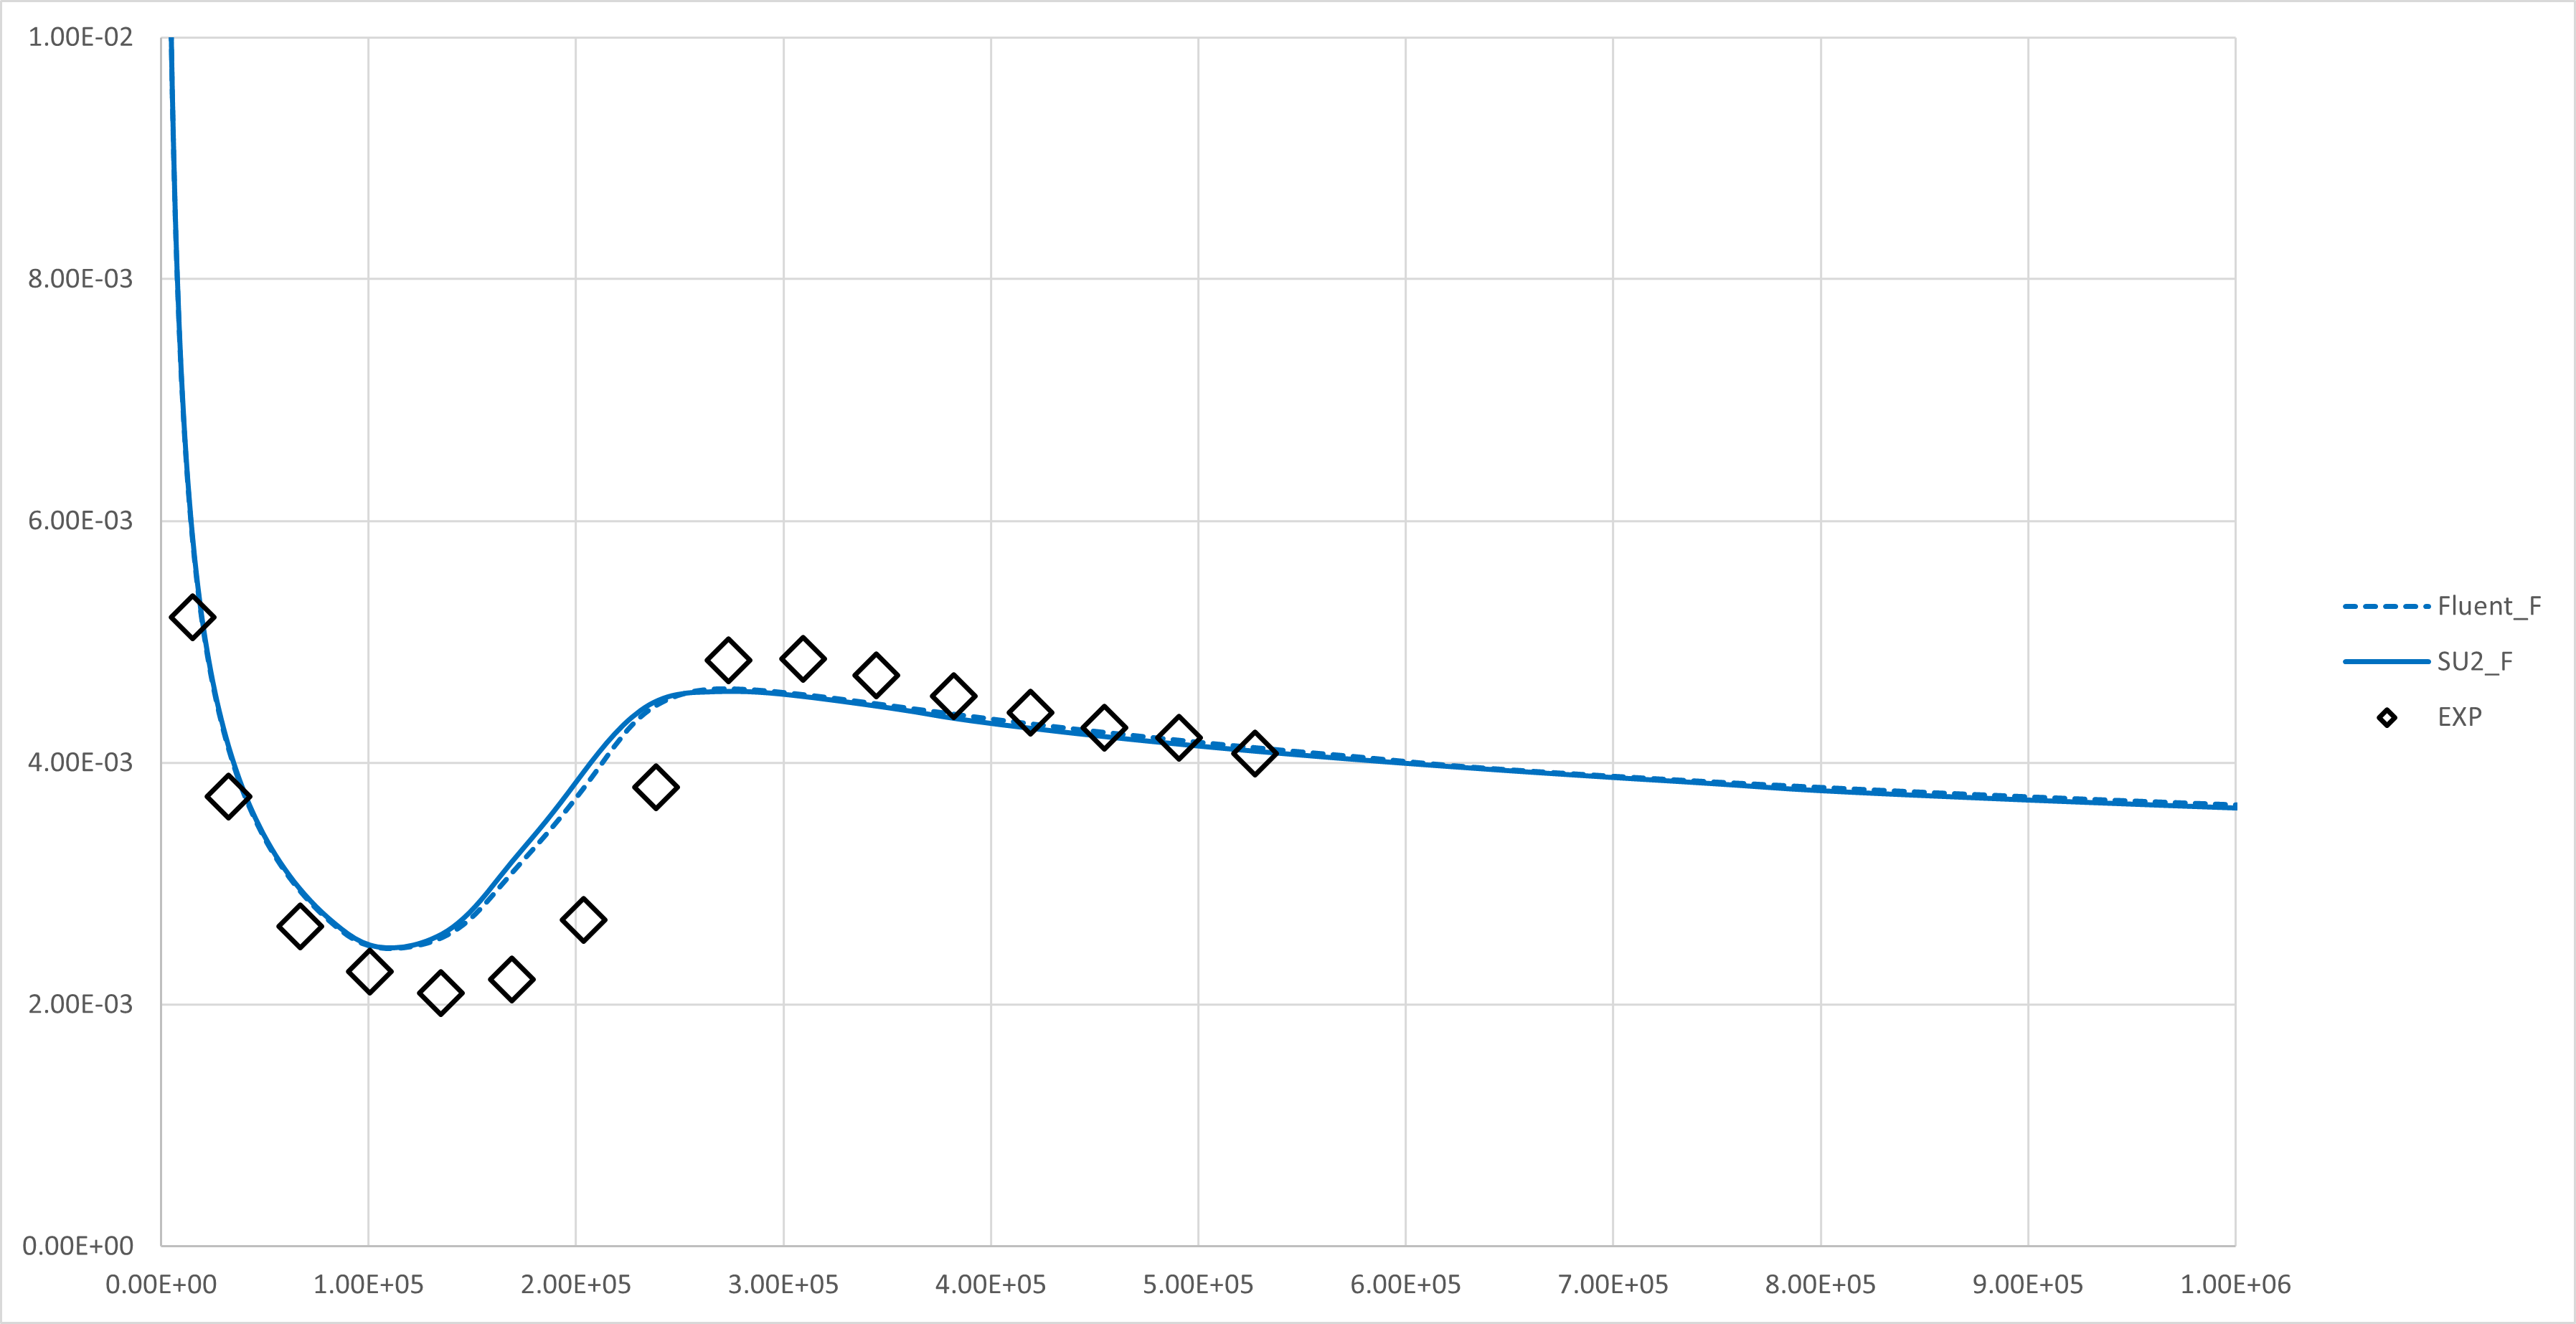
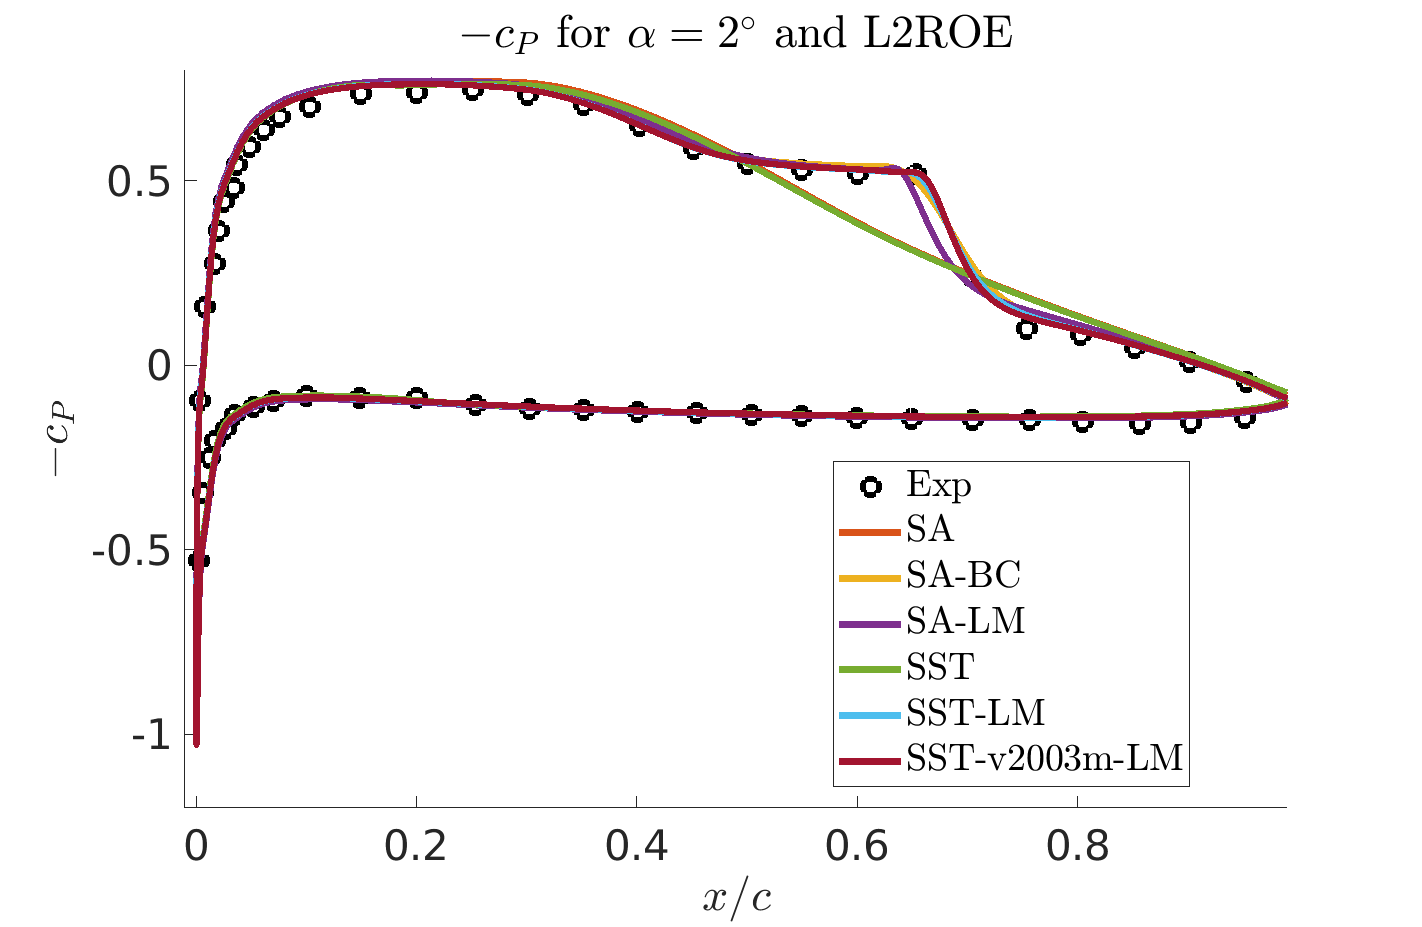
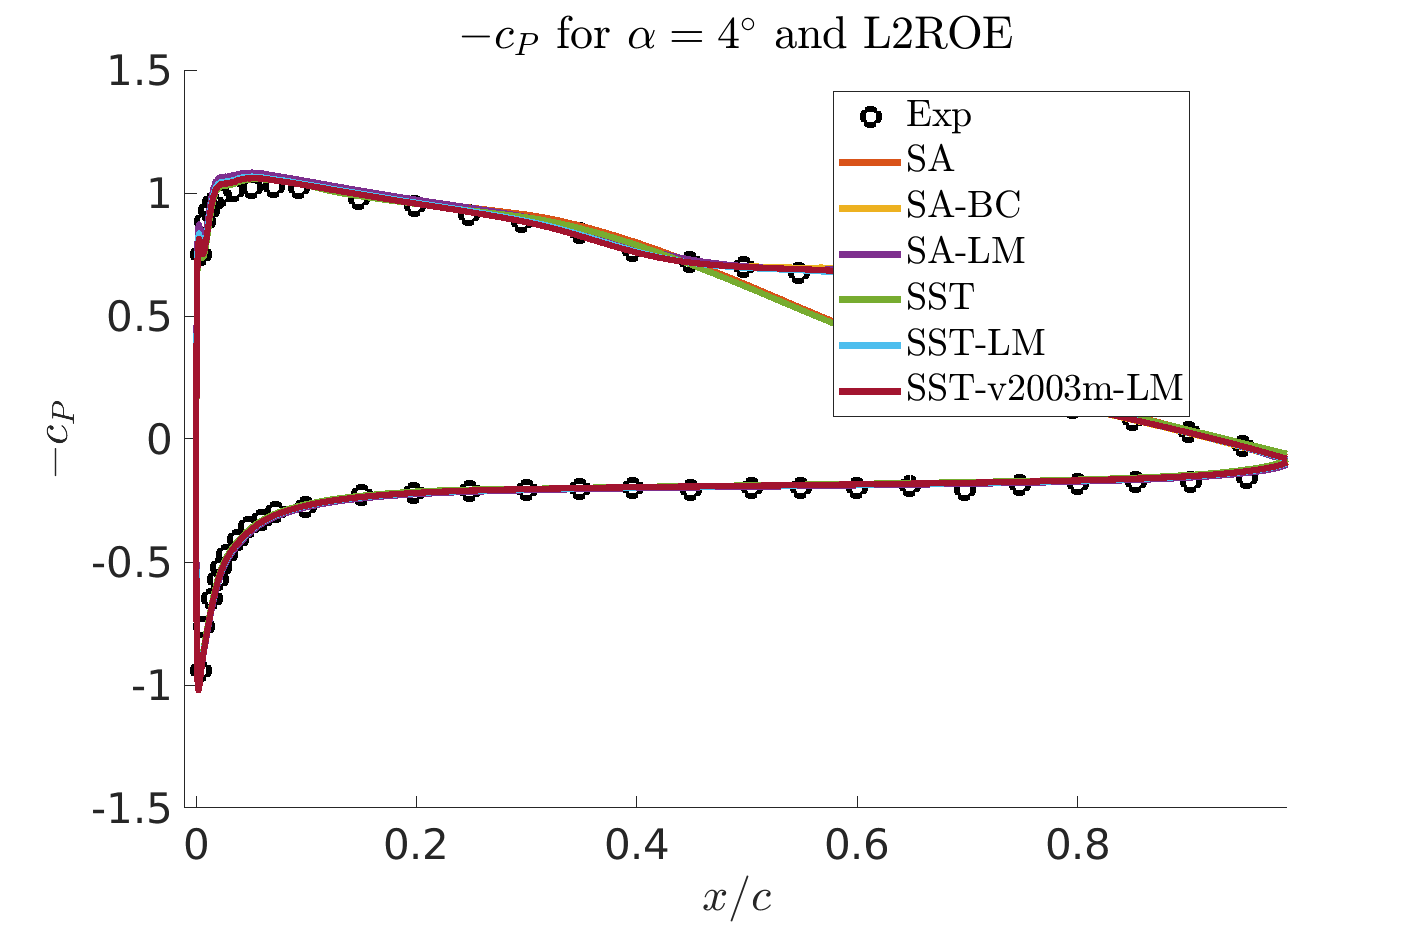
Present results of all grid resolutions and then plot the results of the fine-level grid separately. If you want to see other results of the grid level, you can see them at “vandv_files/LMmodel”. All of the flat plate results(= attached flow) are in good agreement with the Fluent results. But, the NLF0416 results have the oscillation near the separation region both Fluent and SU2. All of the E387 results are in good agreement with respect to experimental results. Only the combination SST_v2003m-LM seems to predict early transition at higher angles of attack.
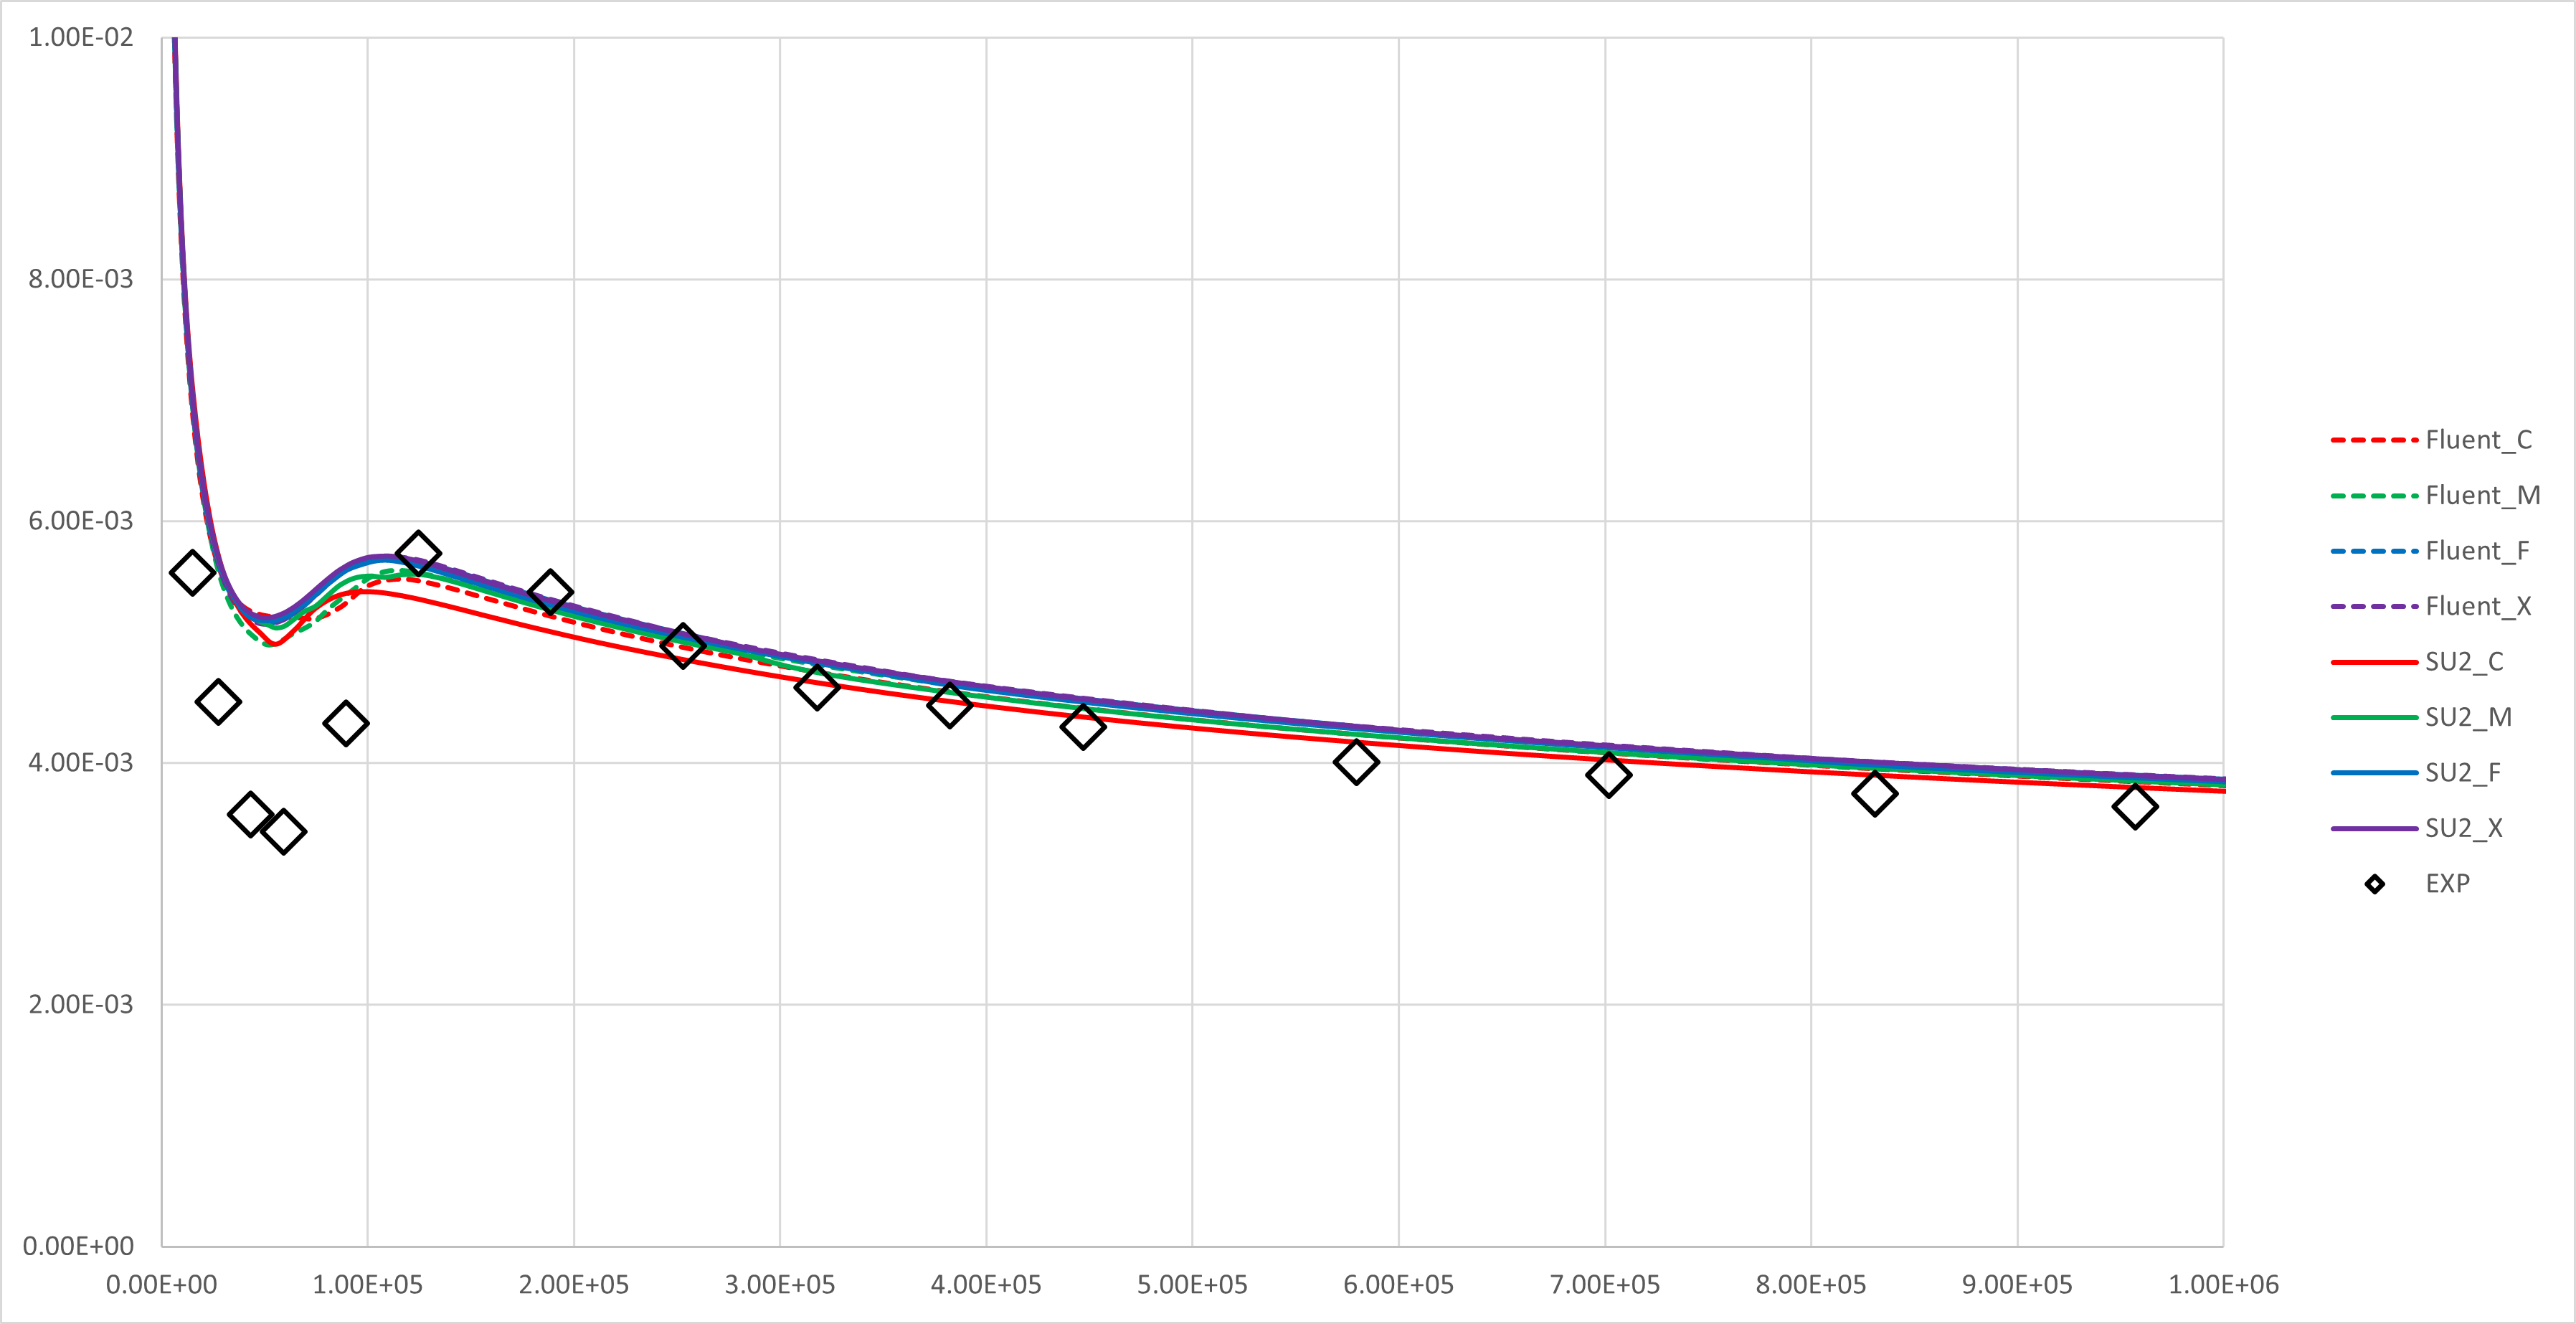
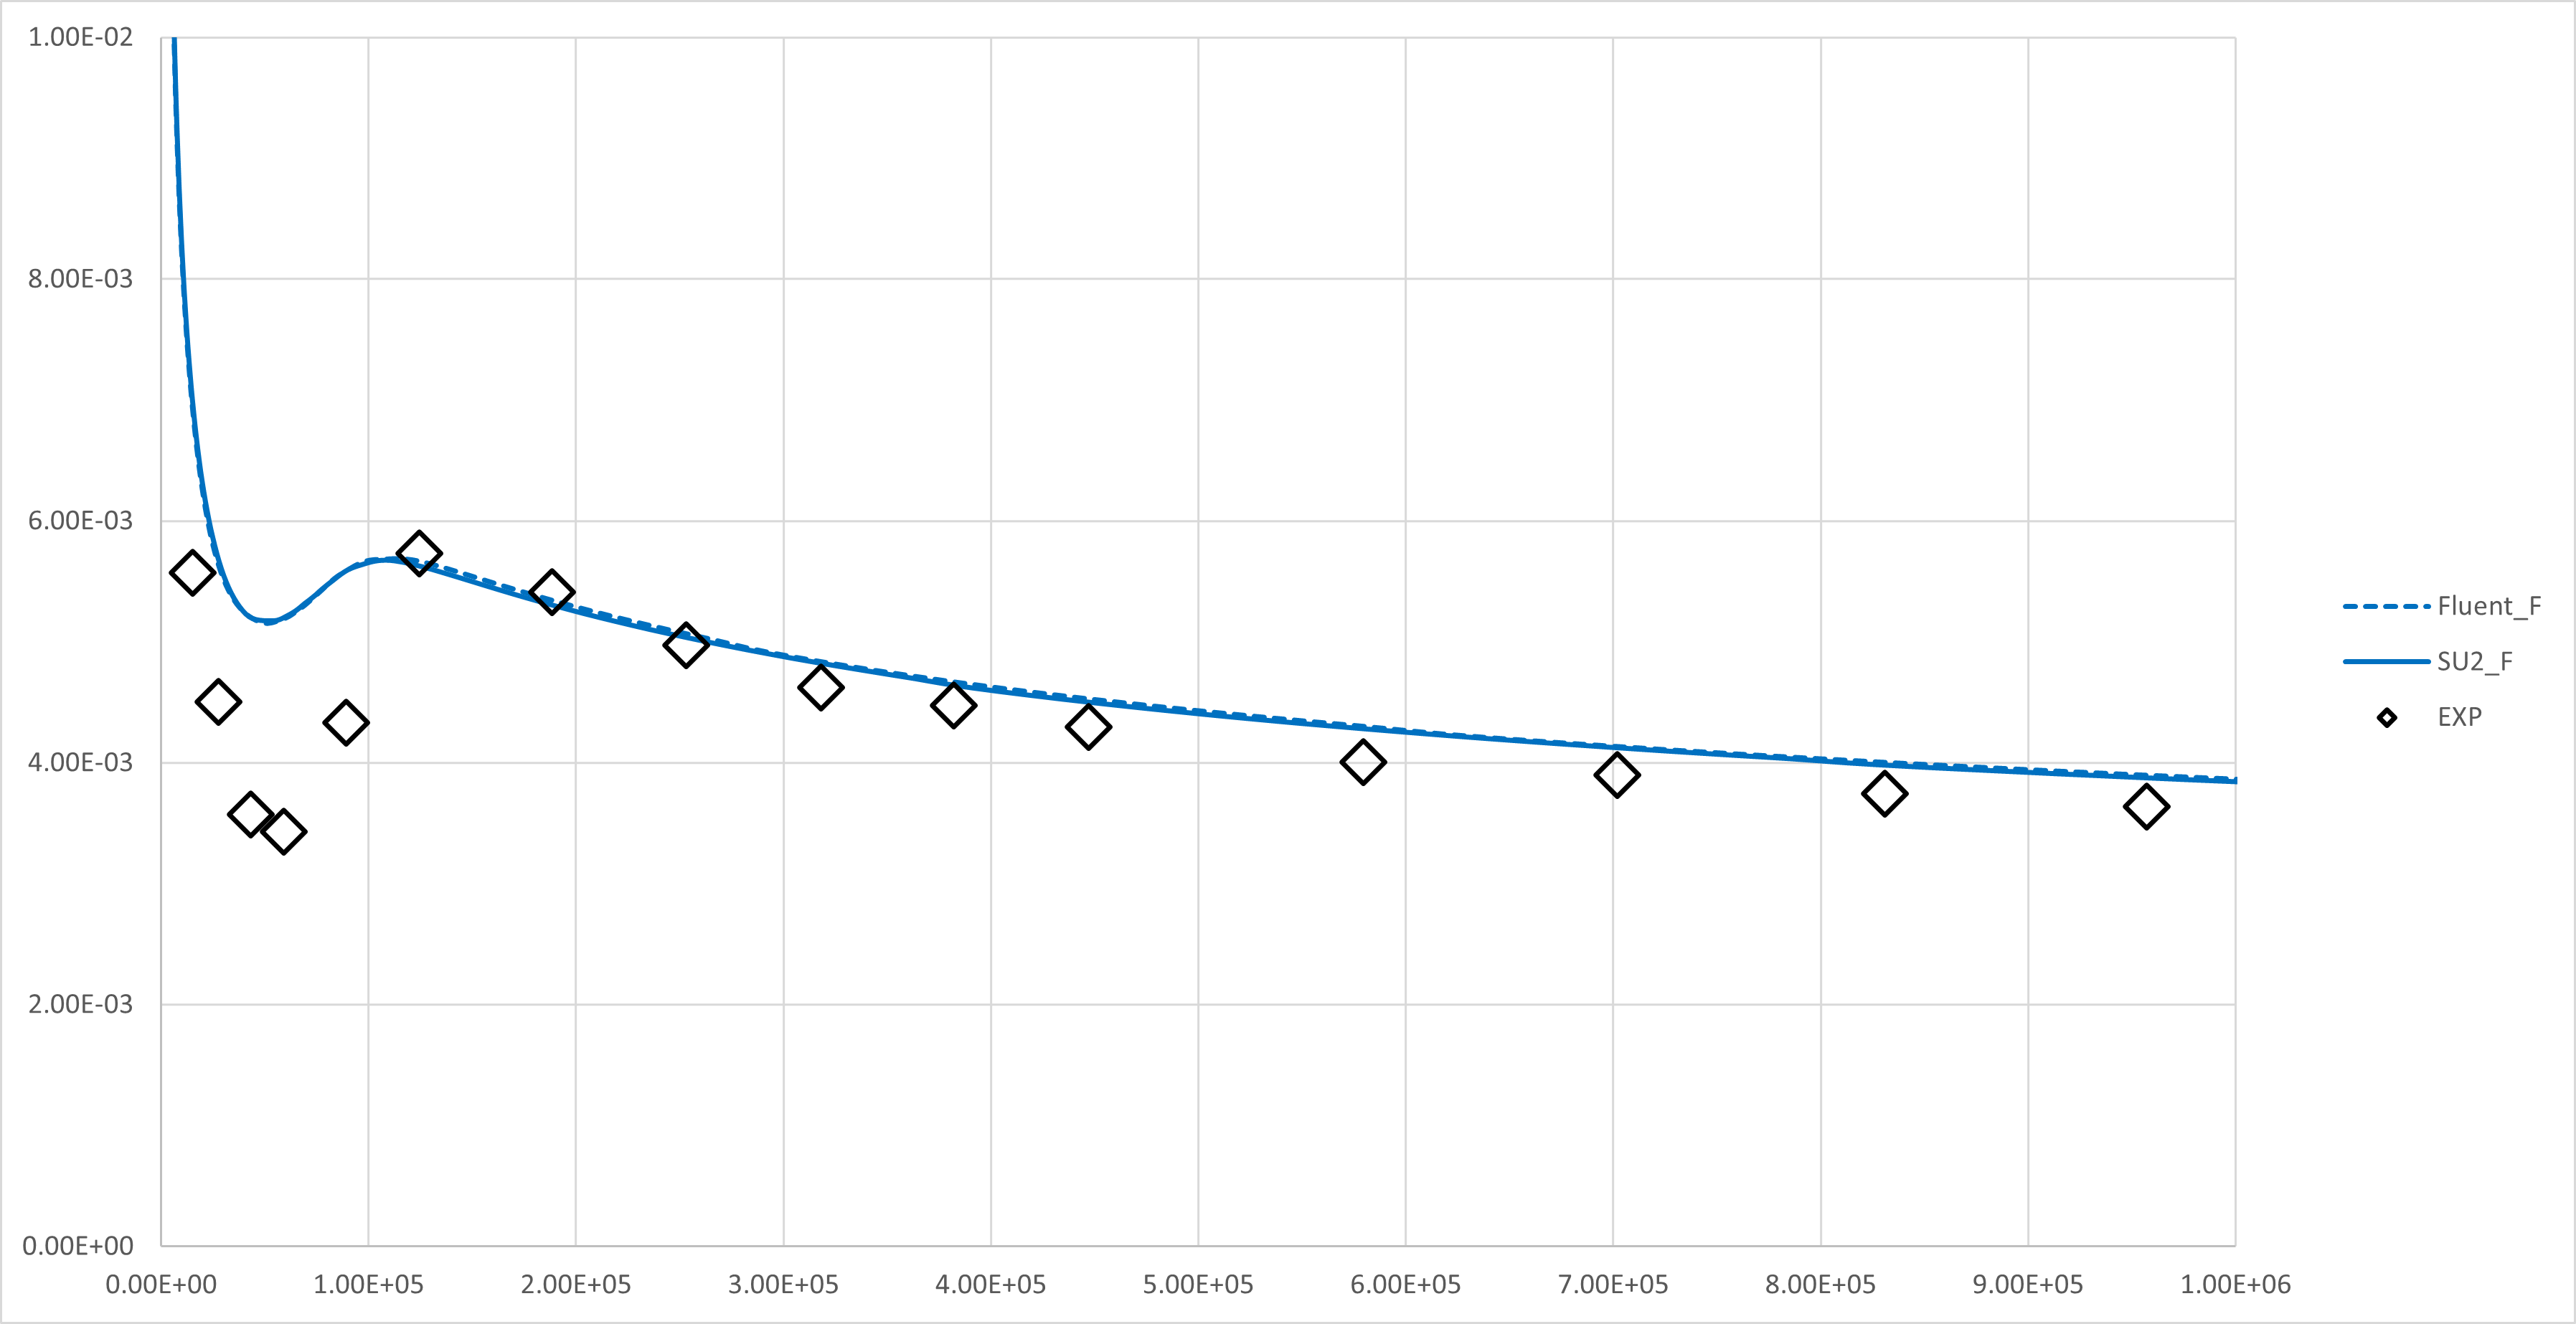
T3A
The experiment data from here
C : Coarse
M : Medium
F : Fine
X : Extra fine
 ### T3B
The experiment data from [here](http://cfd.mace.manchester.ac.uk/ercoftac/)
C : Coarse
M : Medium
F : Fine
X : Extra fine
### T3B
The experiment data from [here](http://cfd.mace.manchester.ac.uk/ercoftac/)
C : Coarse
M : Medium
F : Fine
X : Extra fine
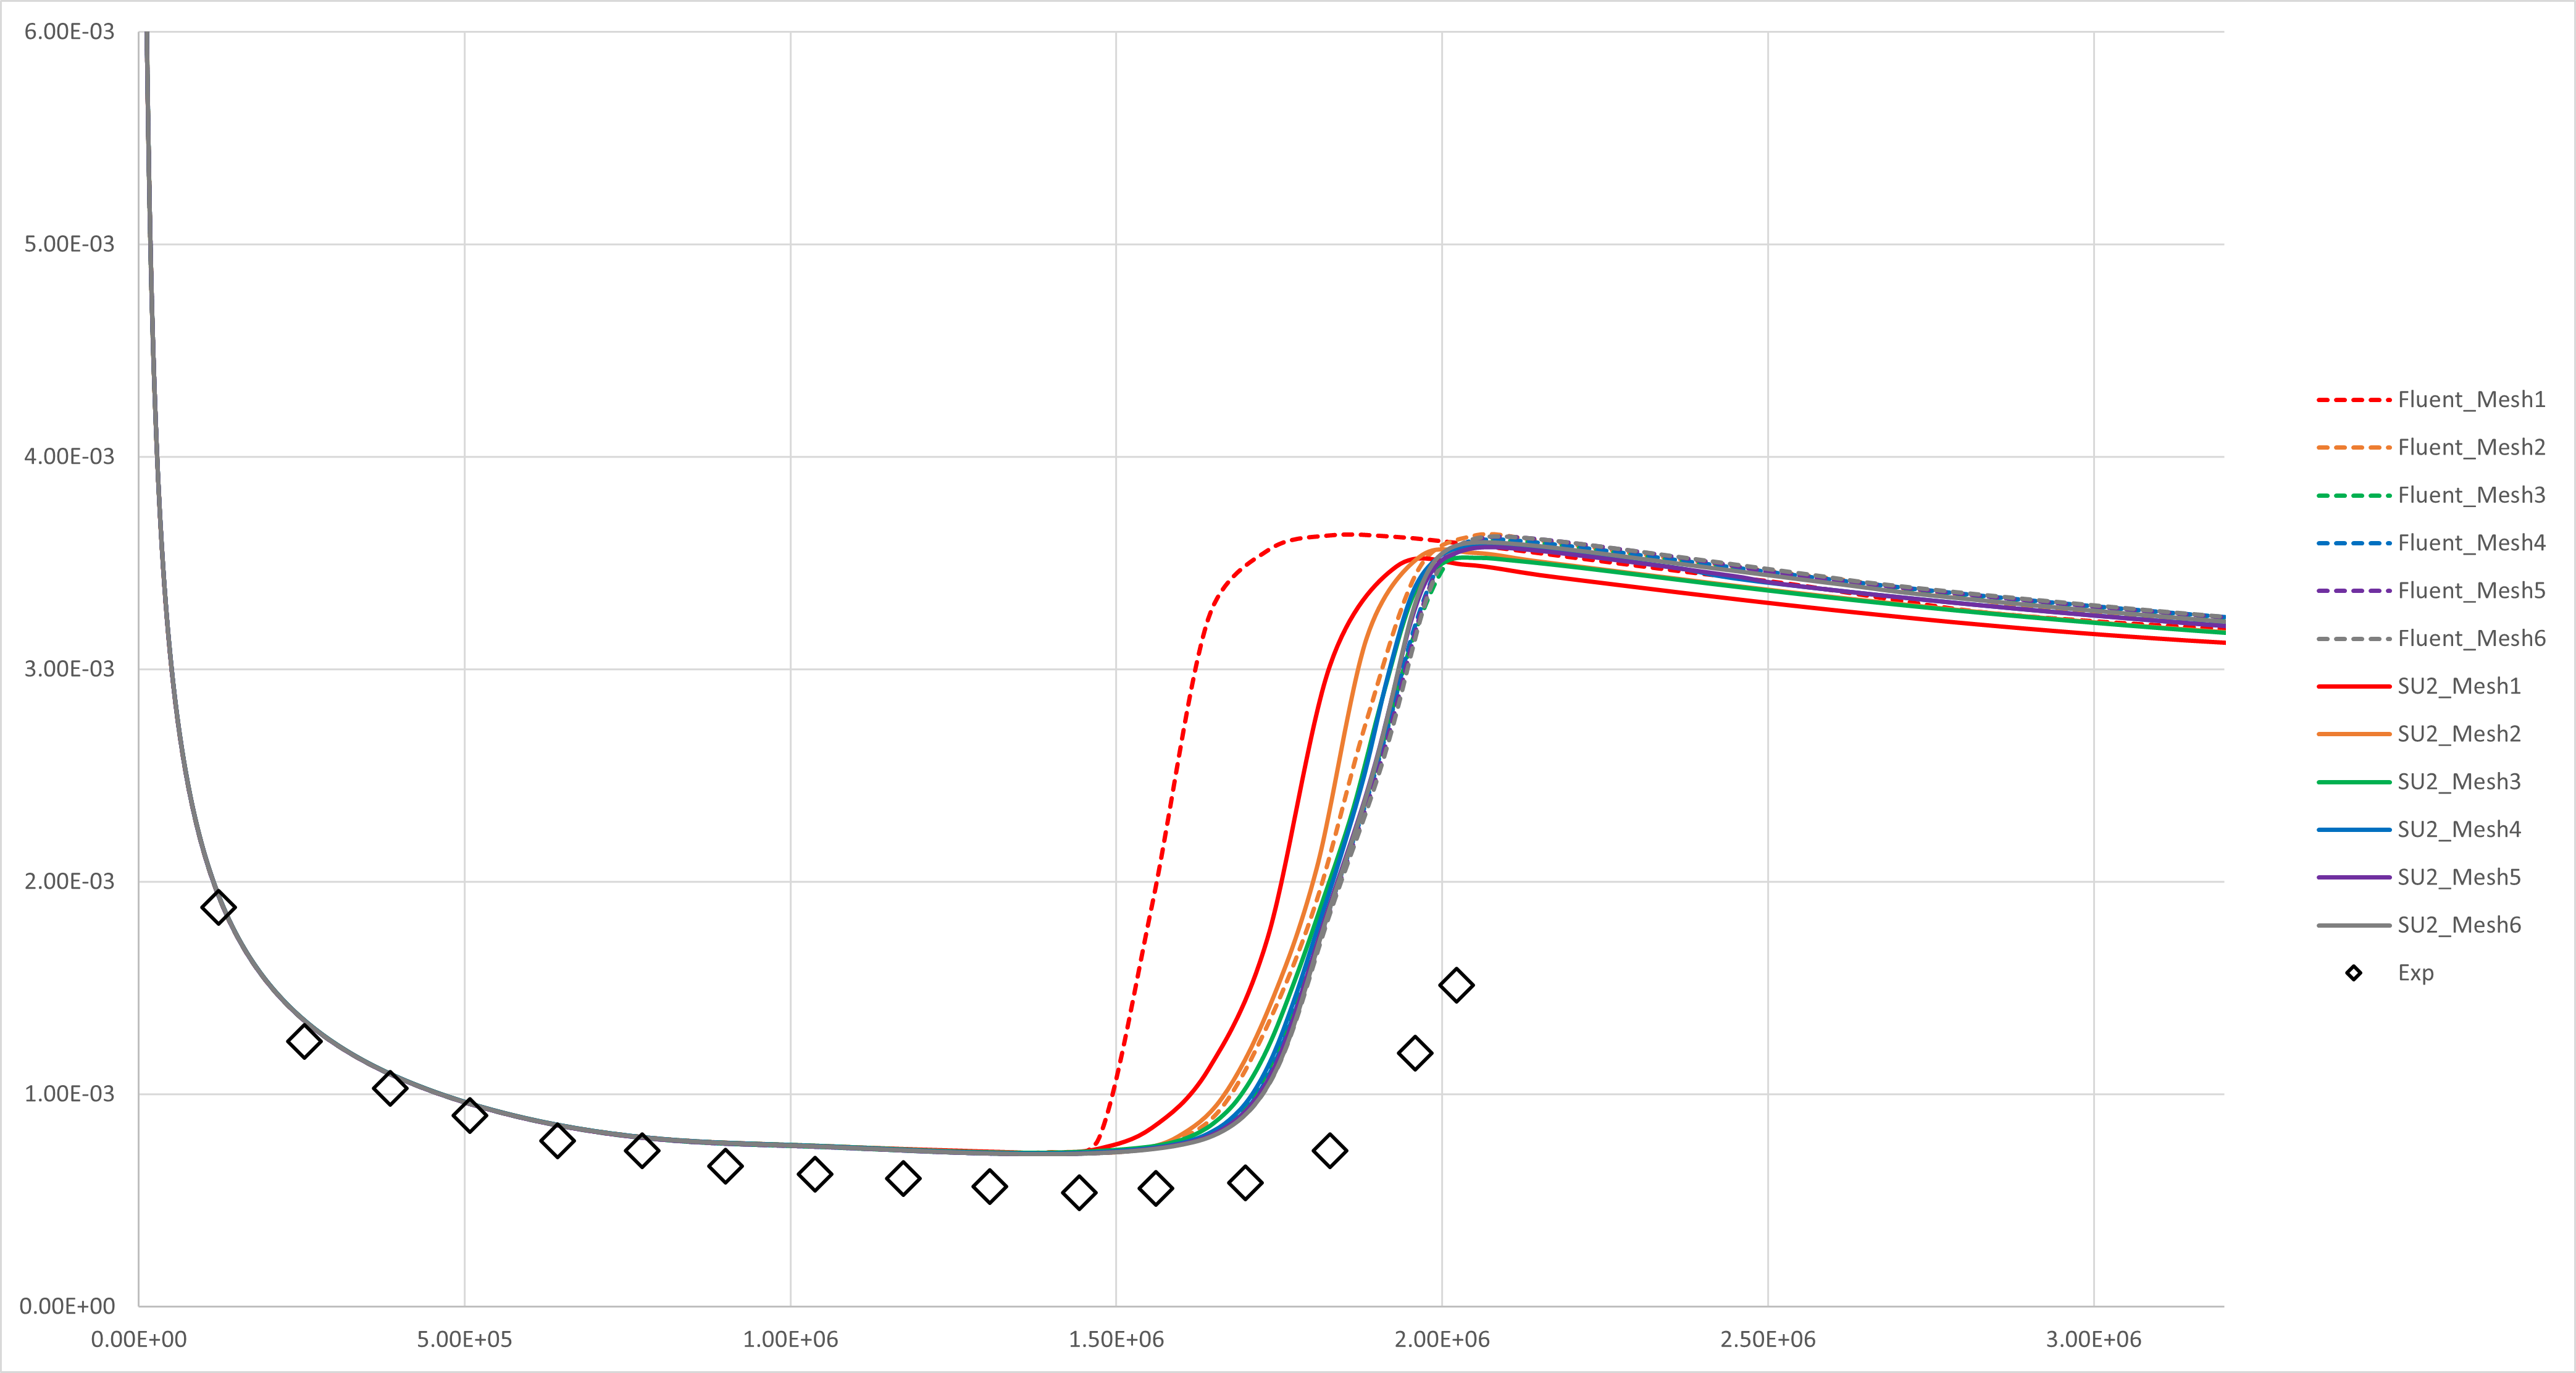
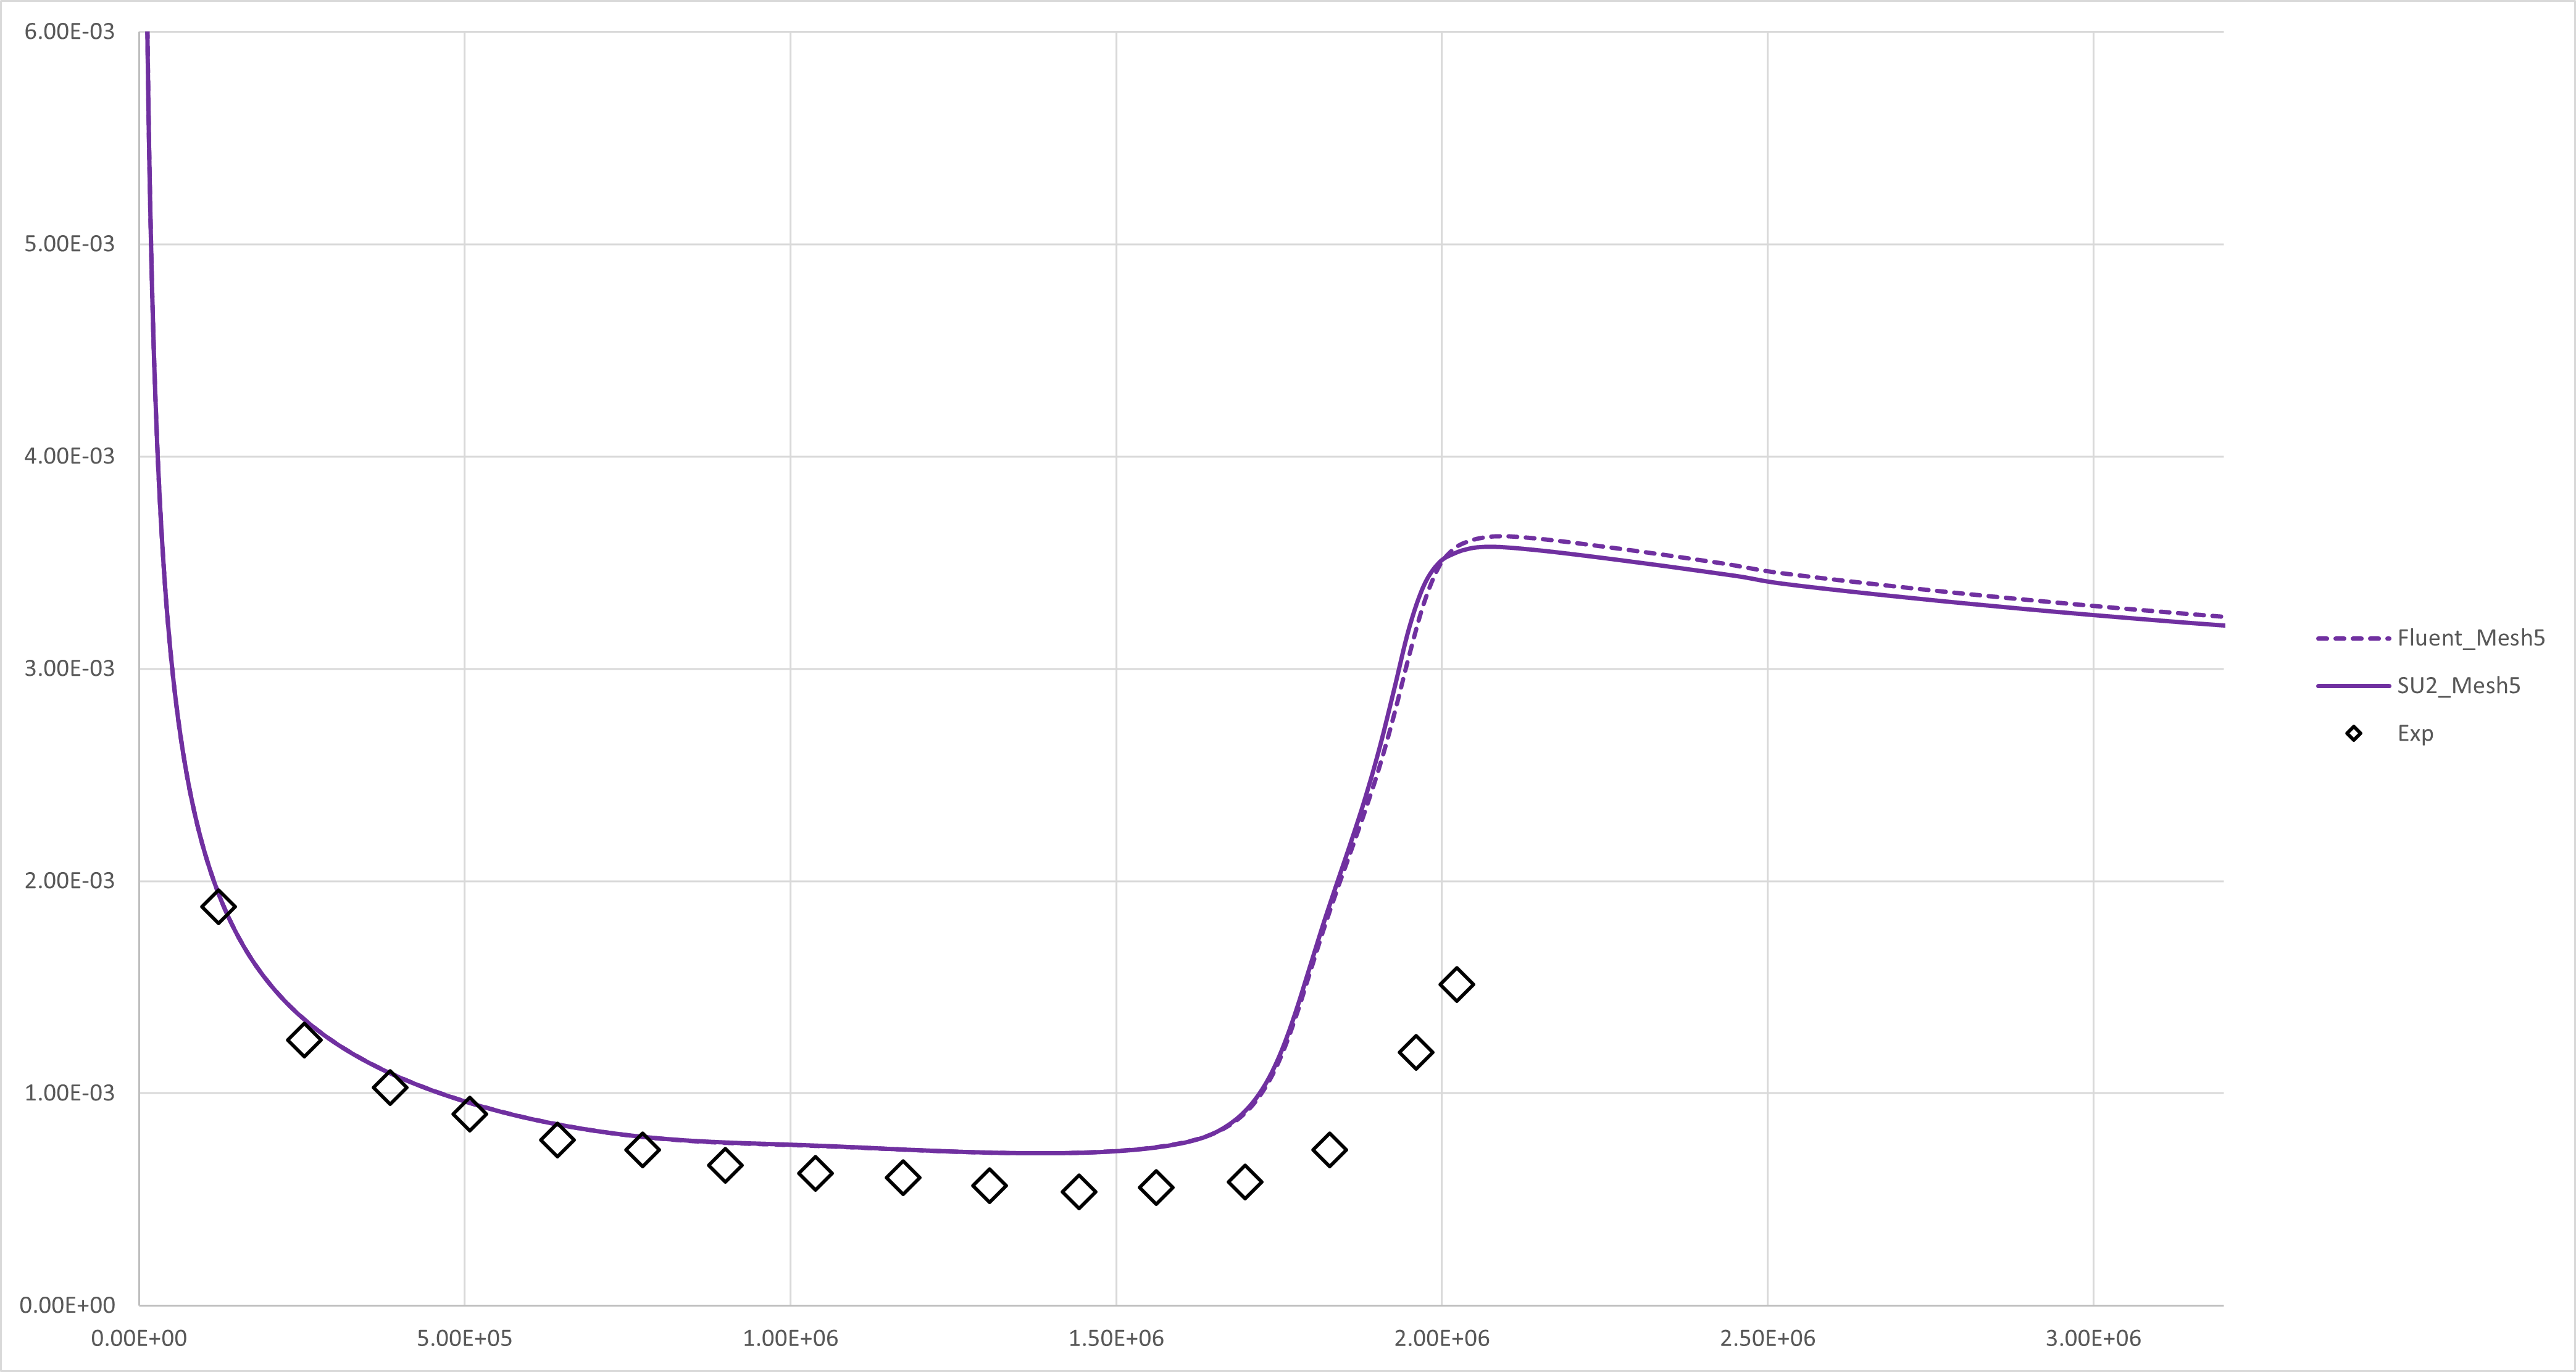
 ### T3Am
The experiment data from [here](http://cfd.mace.manchester.ac.uk/ercoftac/)
Mesh_1 : Tiny
Mesh_2 : Coarse
Mesh_3 : Medium
Mesh_4 : Fine
Mesh_5 : Extra Fine
Mesh_6 : Ultra Fine
### T3Am
The experiment data from [here](http://cfd.mace.manchester.ac.uk/ercoftac/)
Mesh_1 : Tiny
Mesh_2 : Coarse
Mesh_3 : Medium
Mesh_4 : Fine
Mesh_5 : Extra Fine
Mesh_6 : Ultra Fine
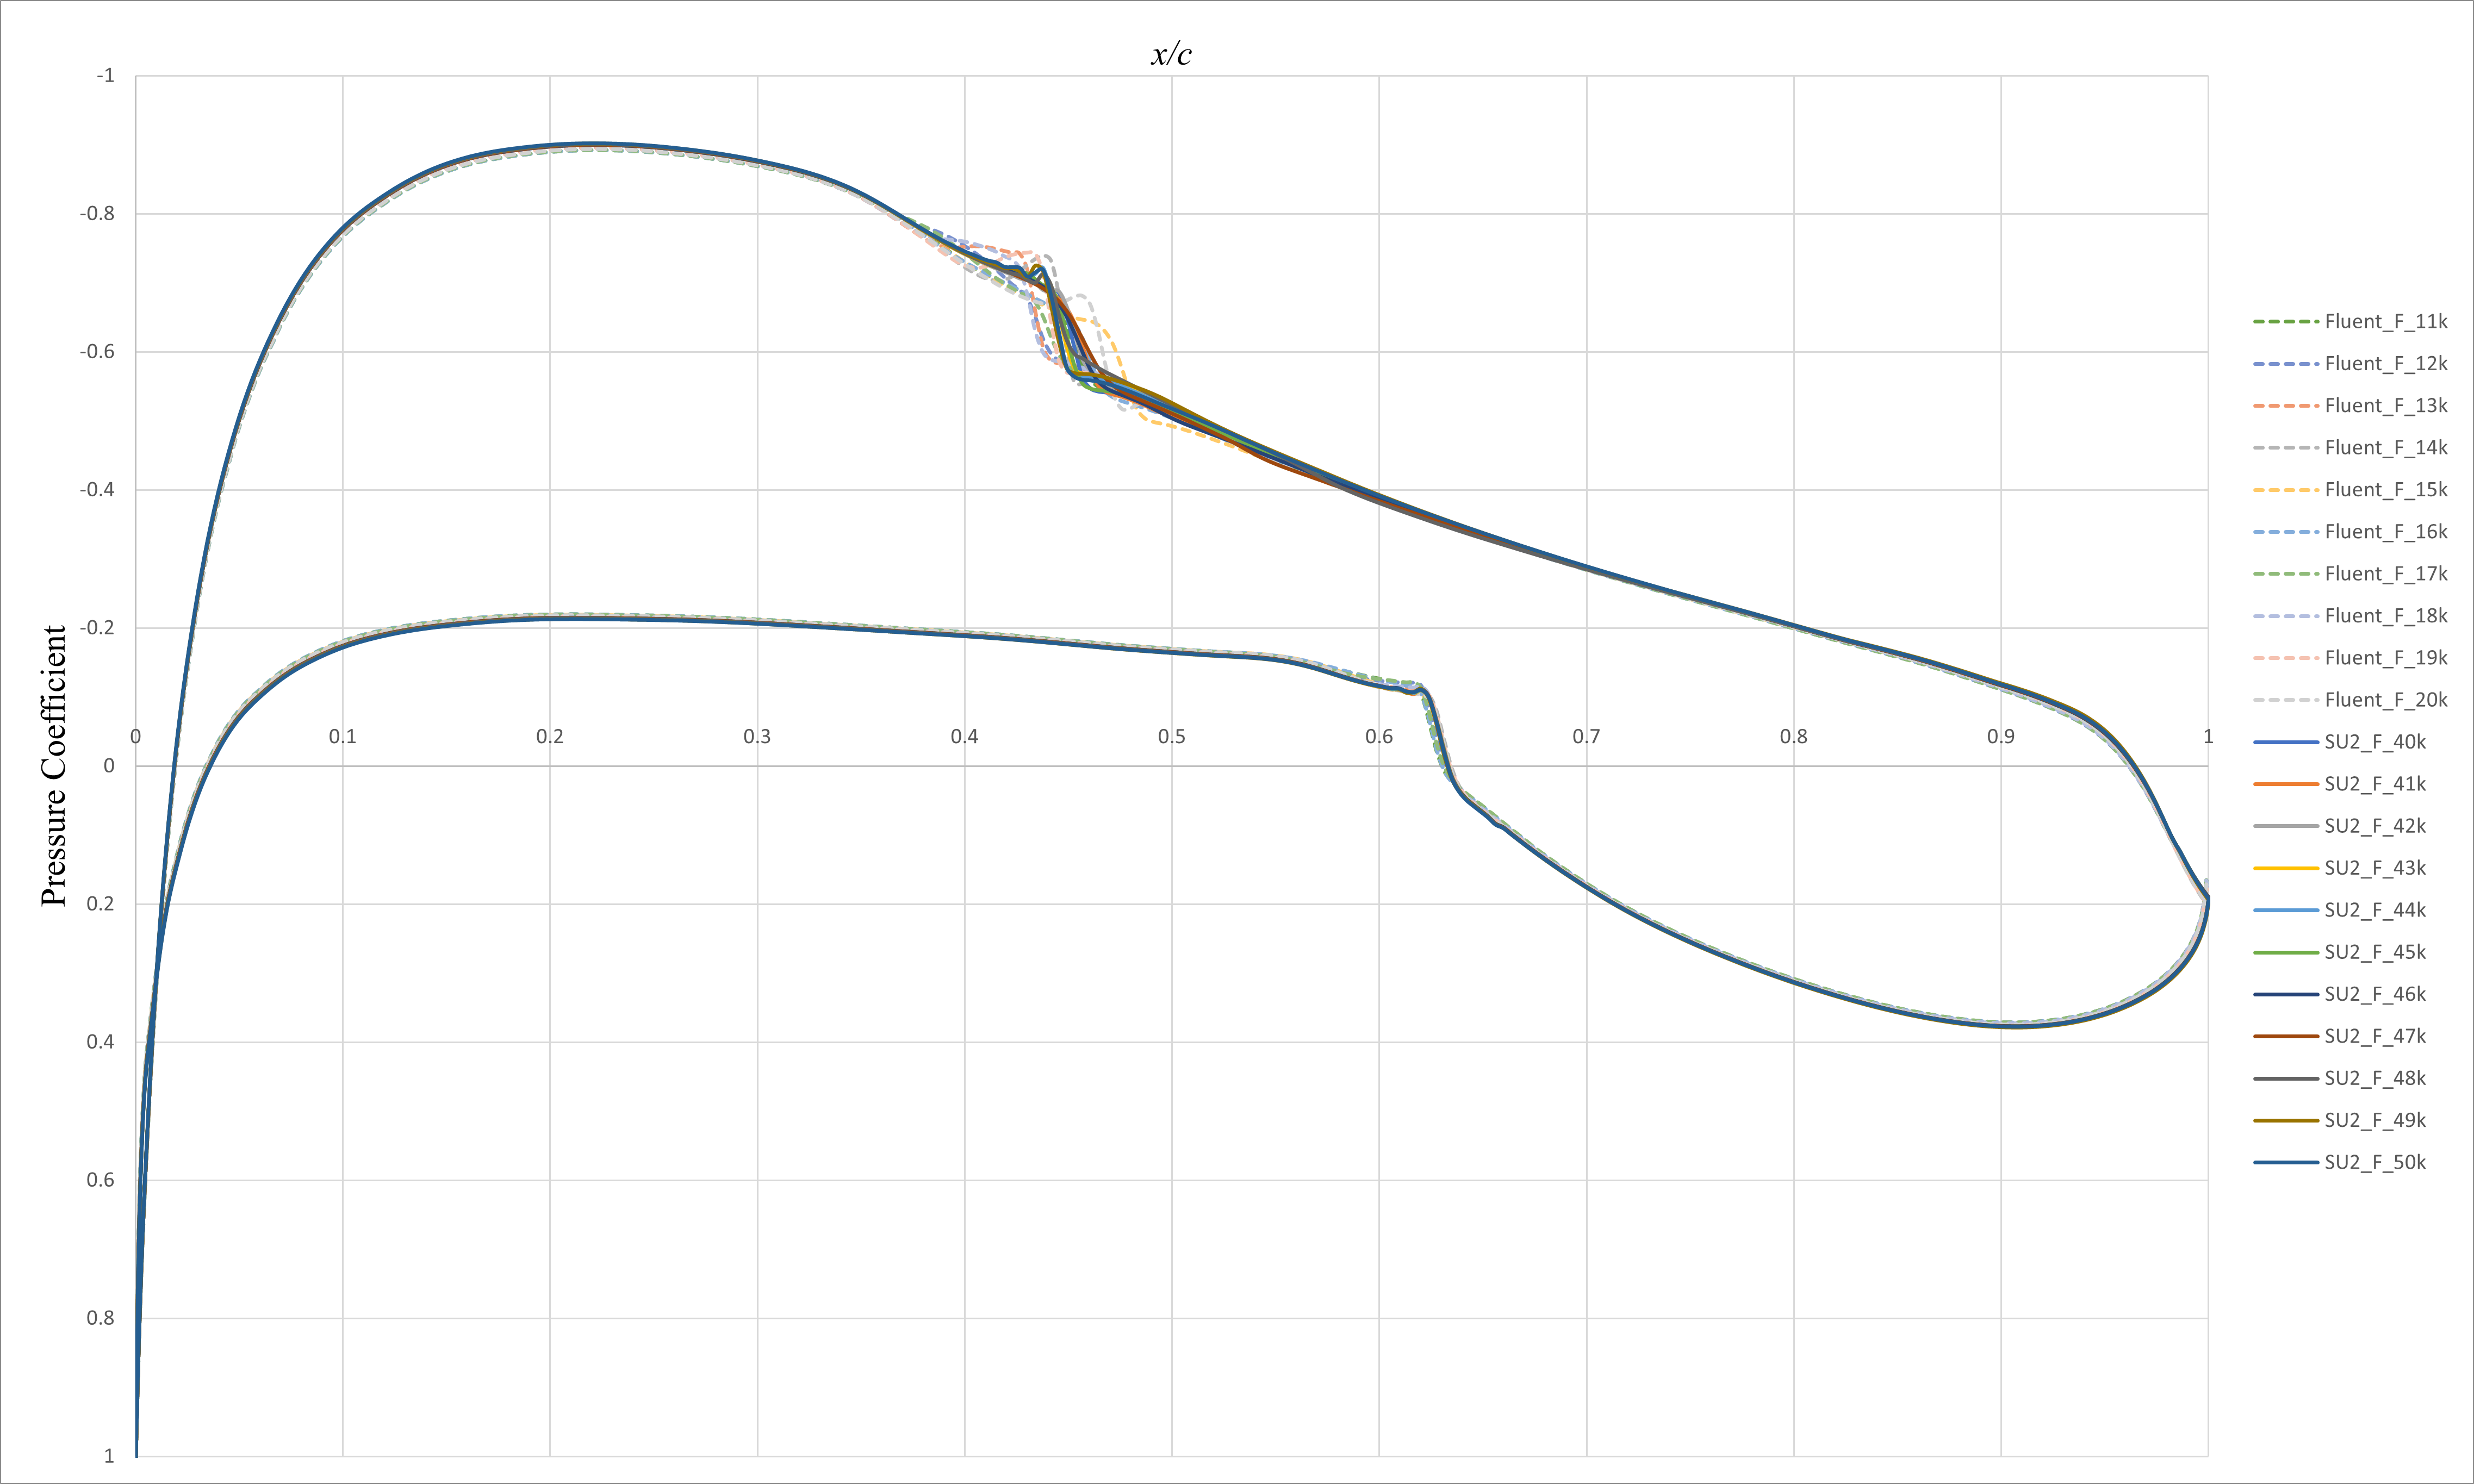
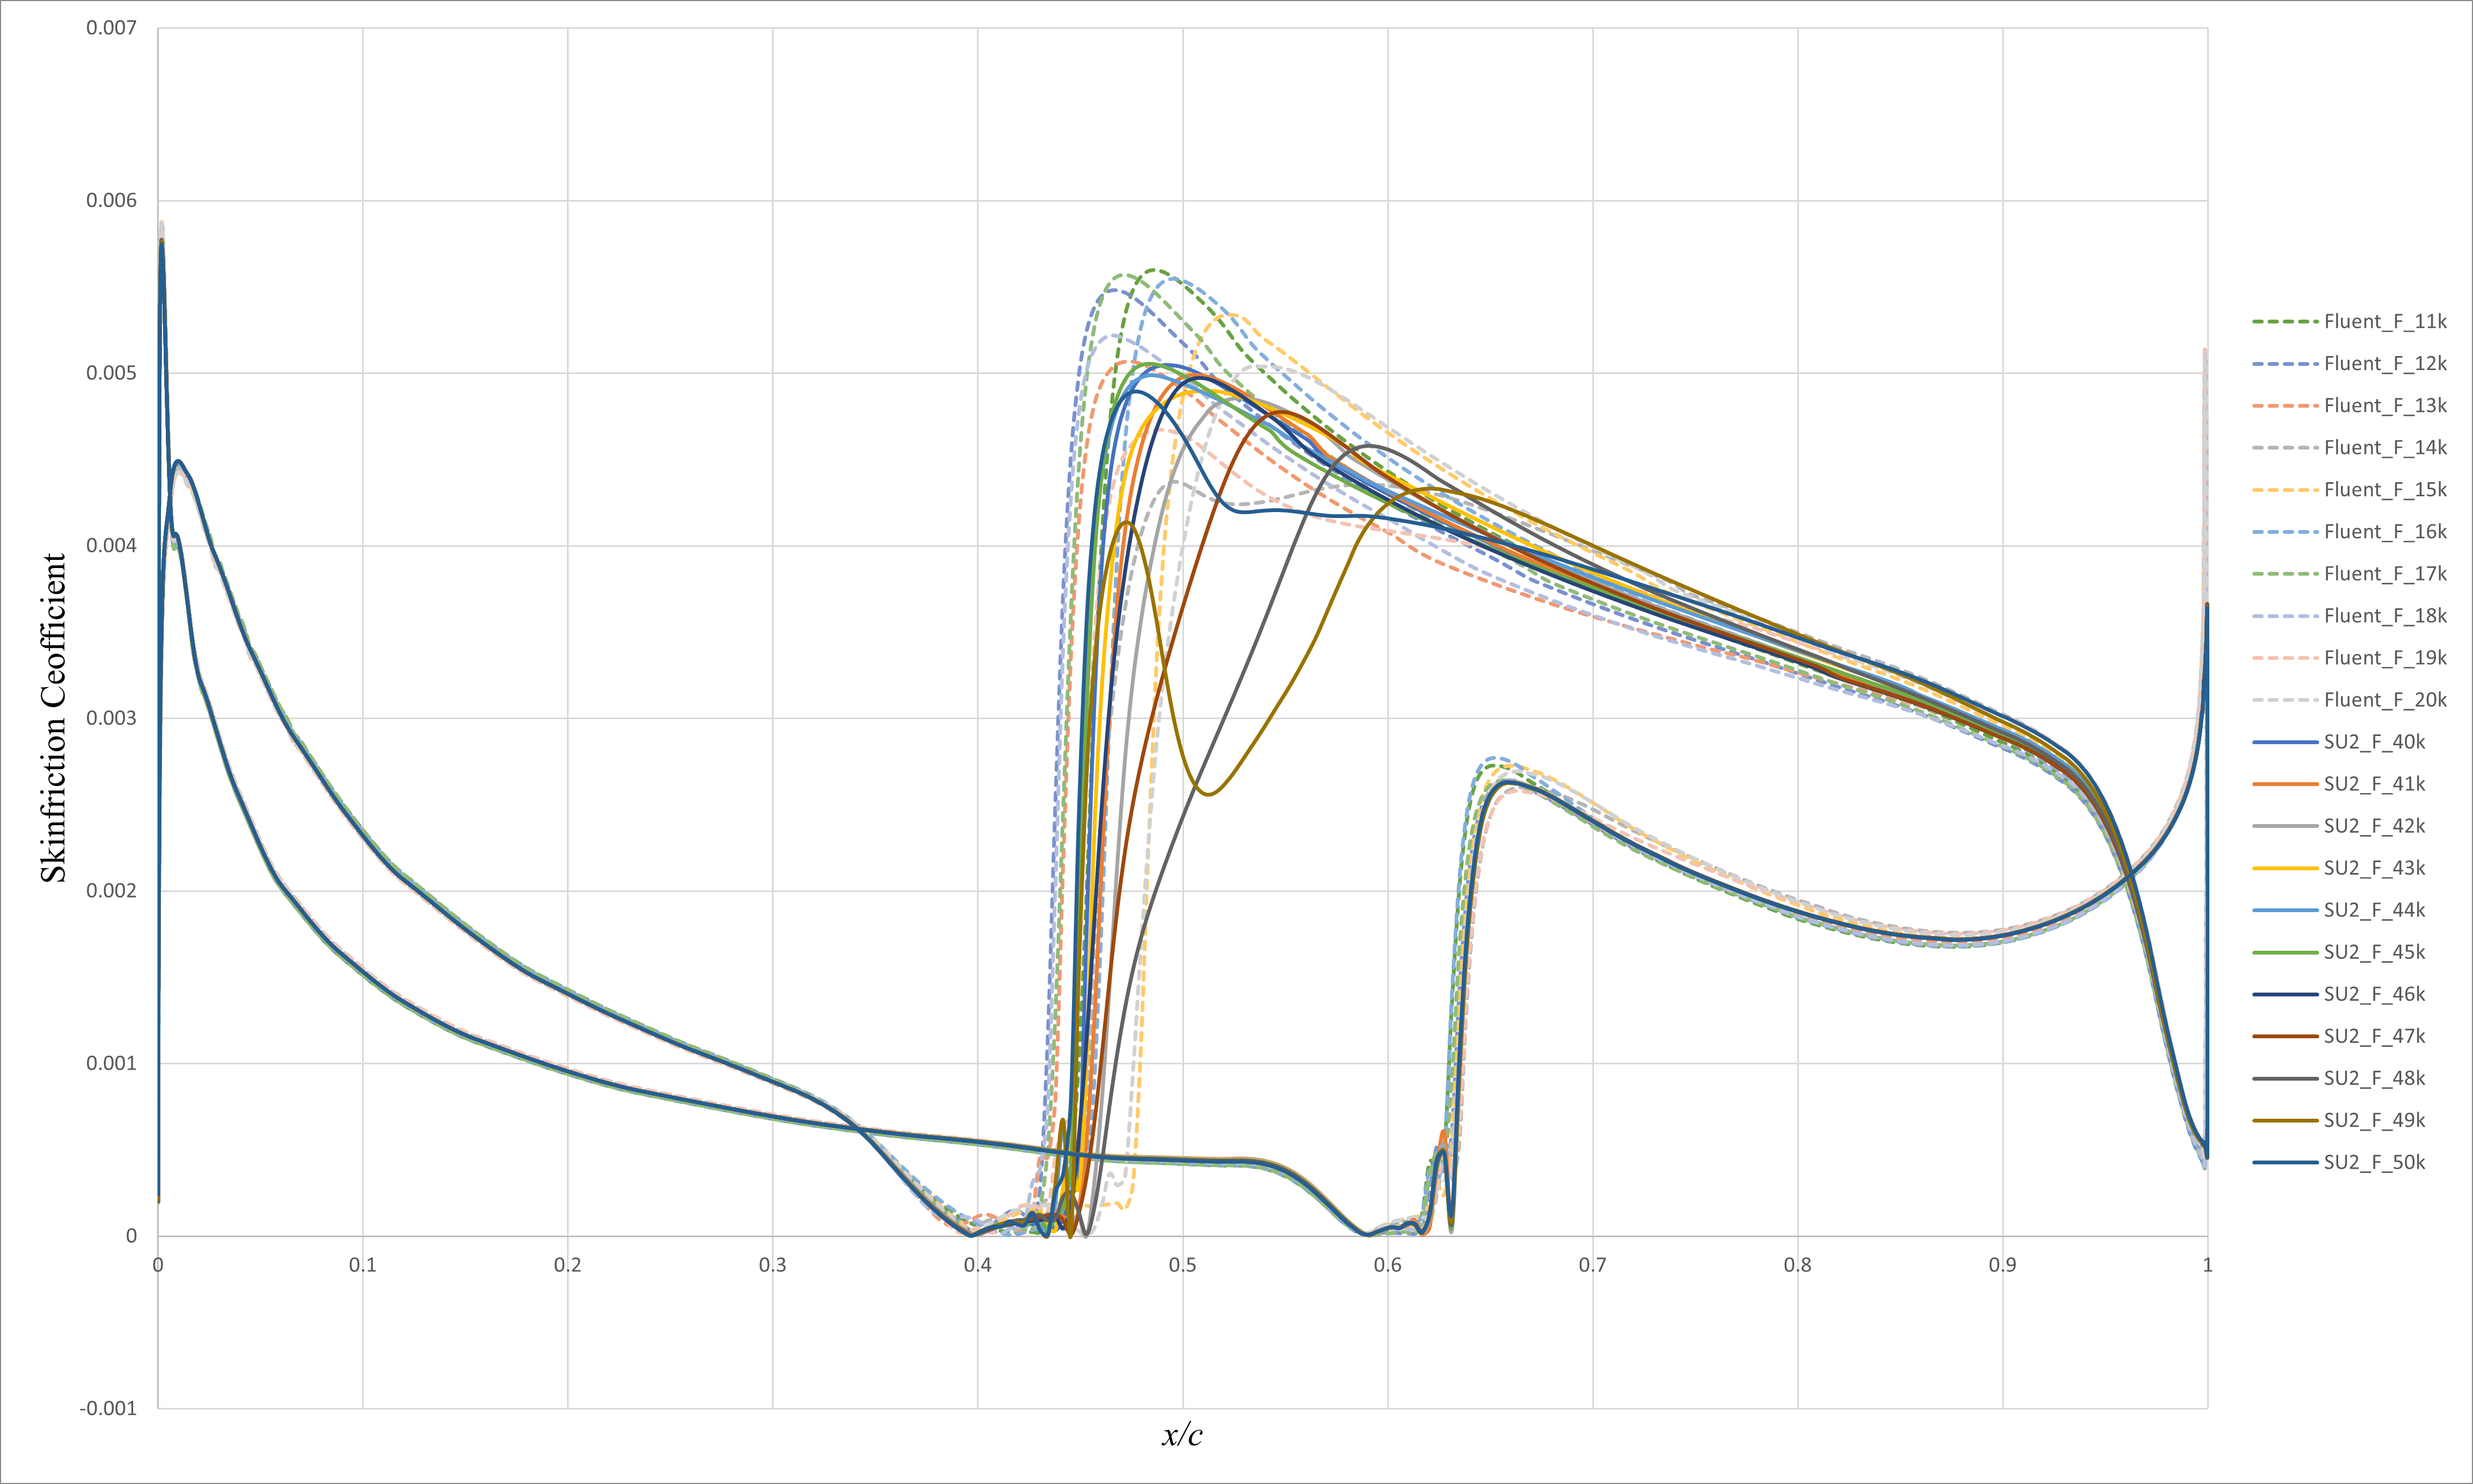
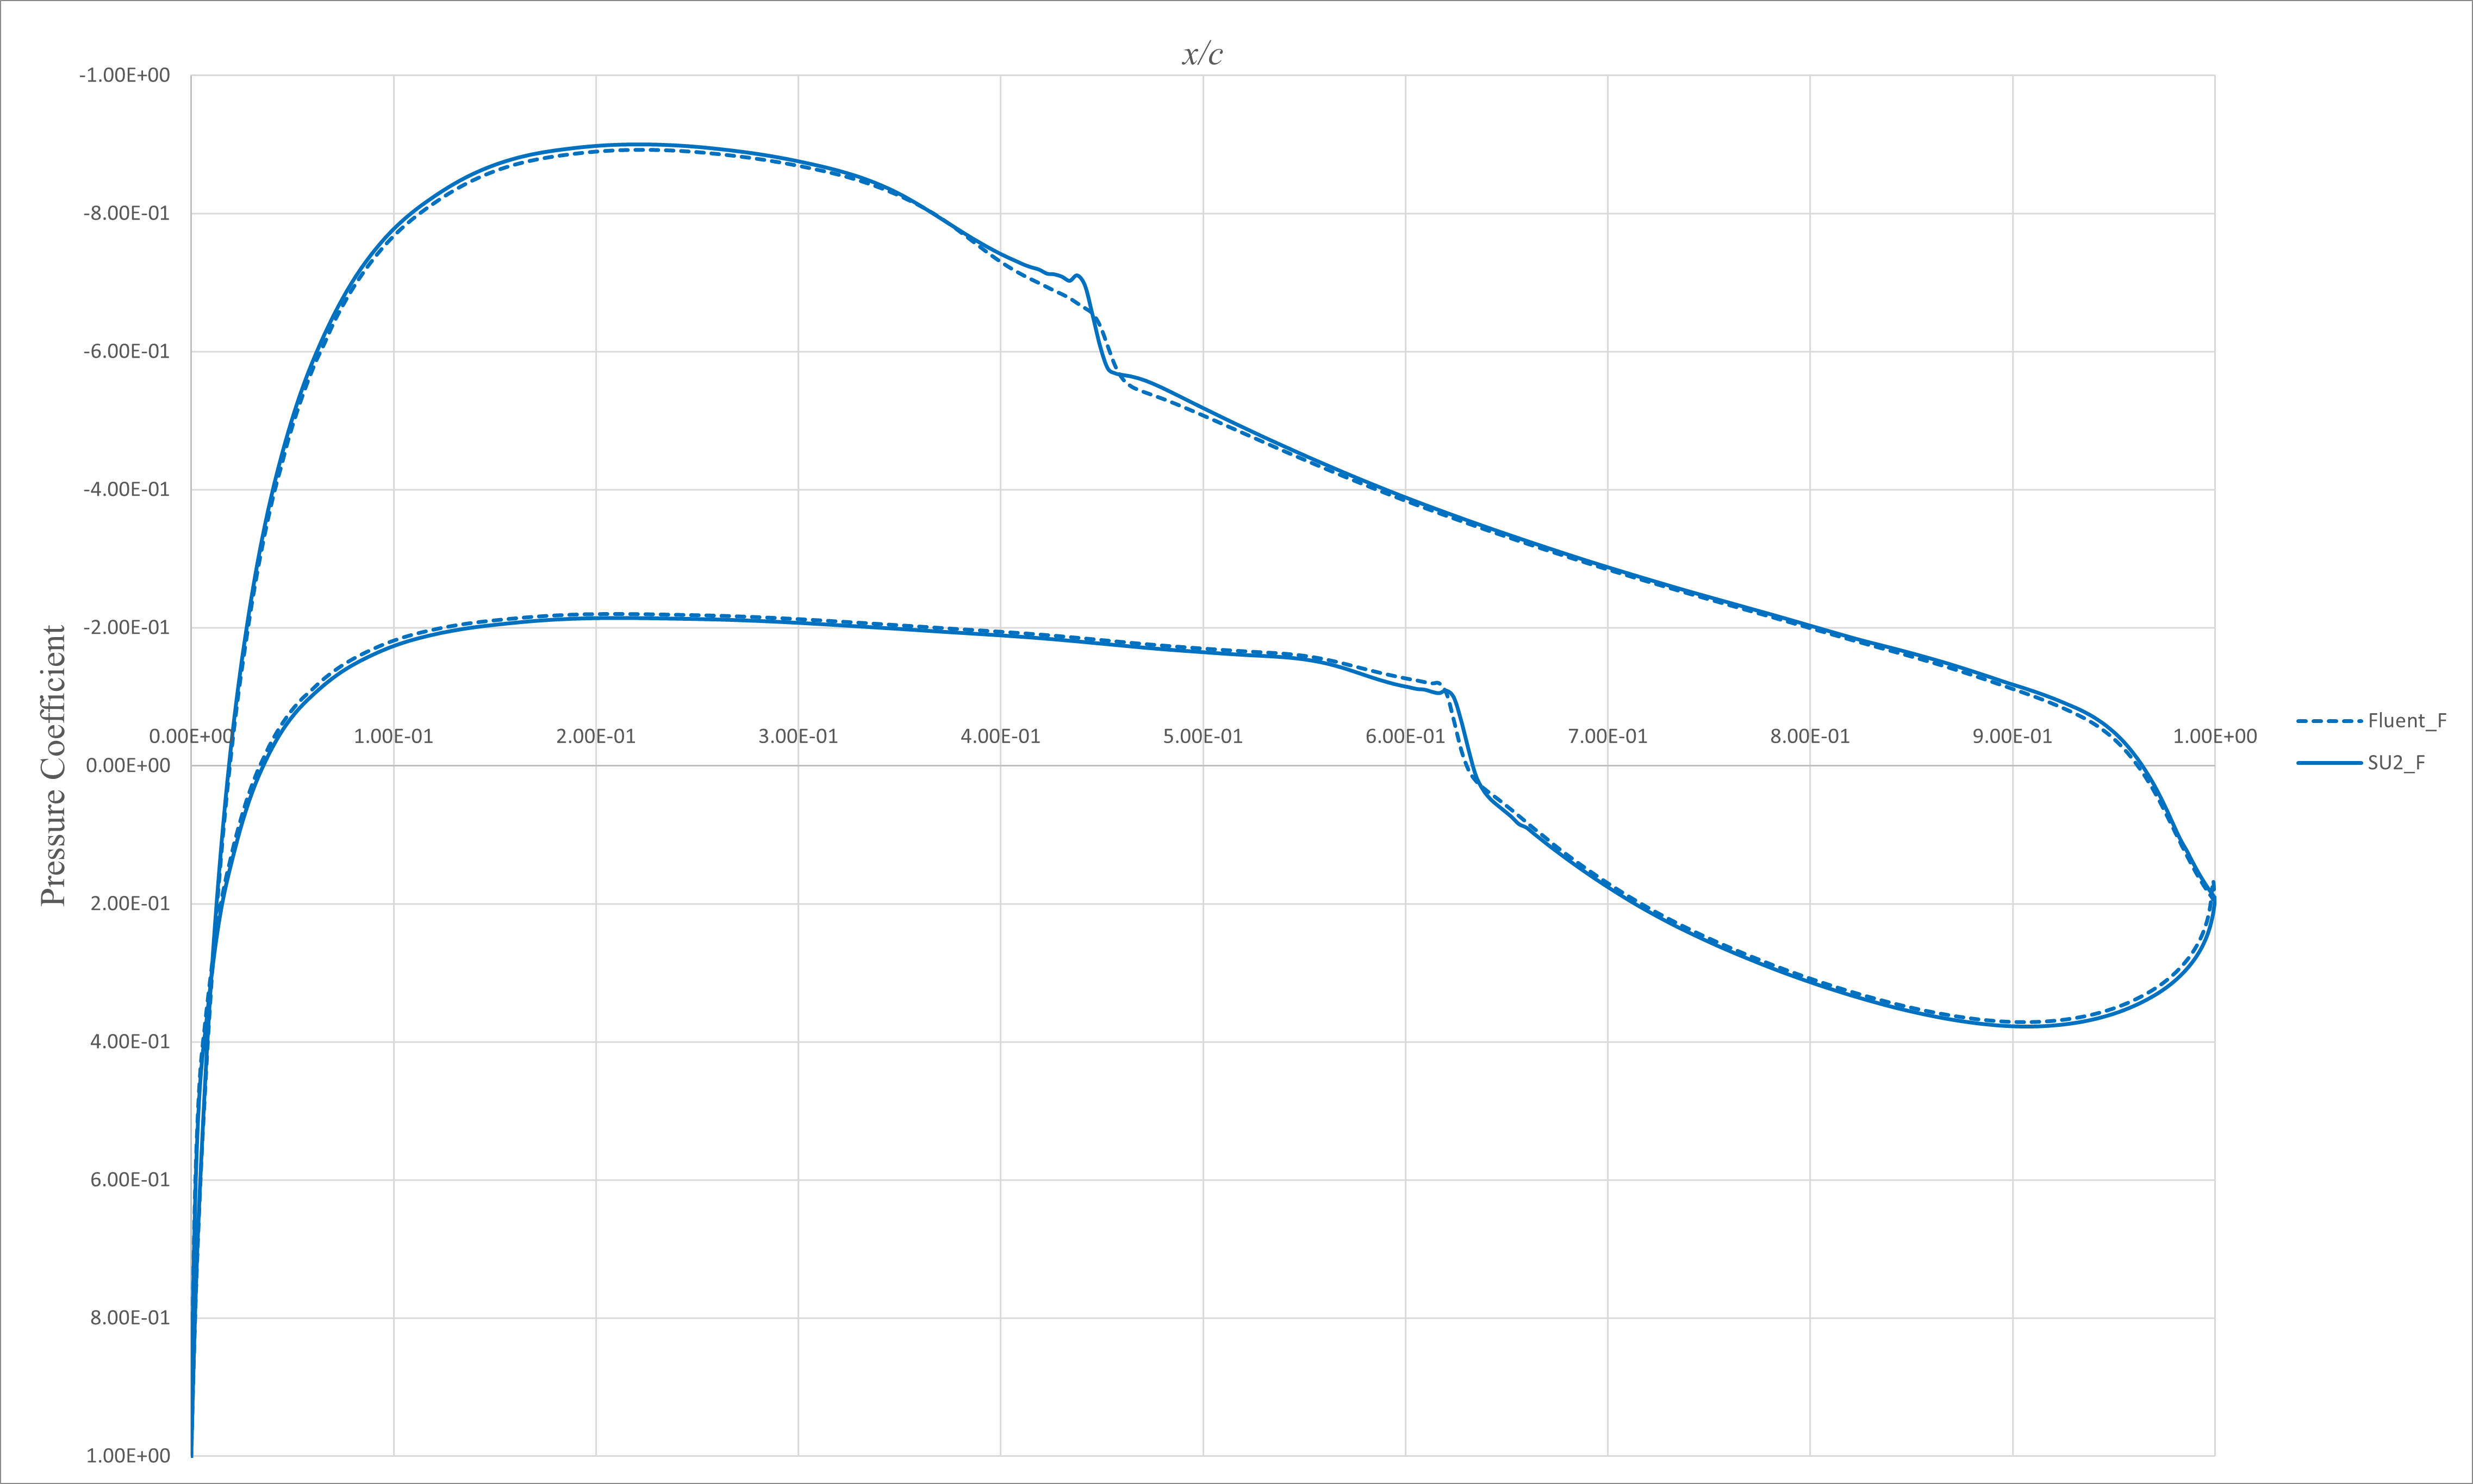
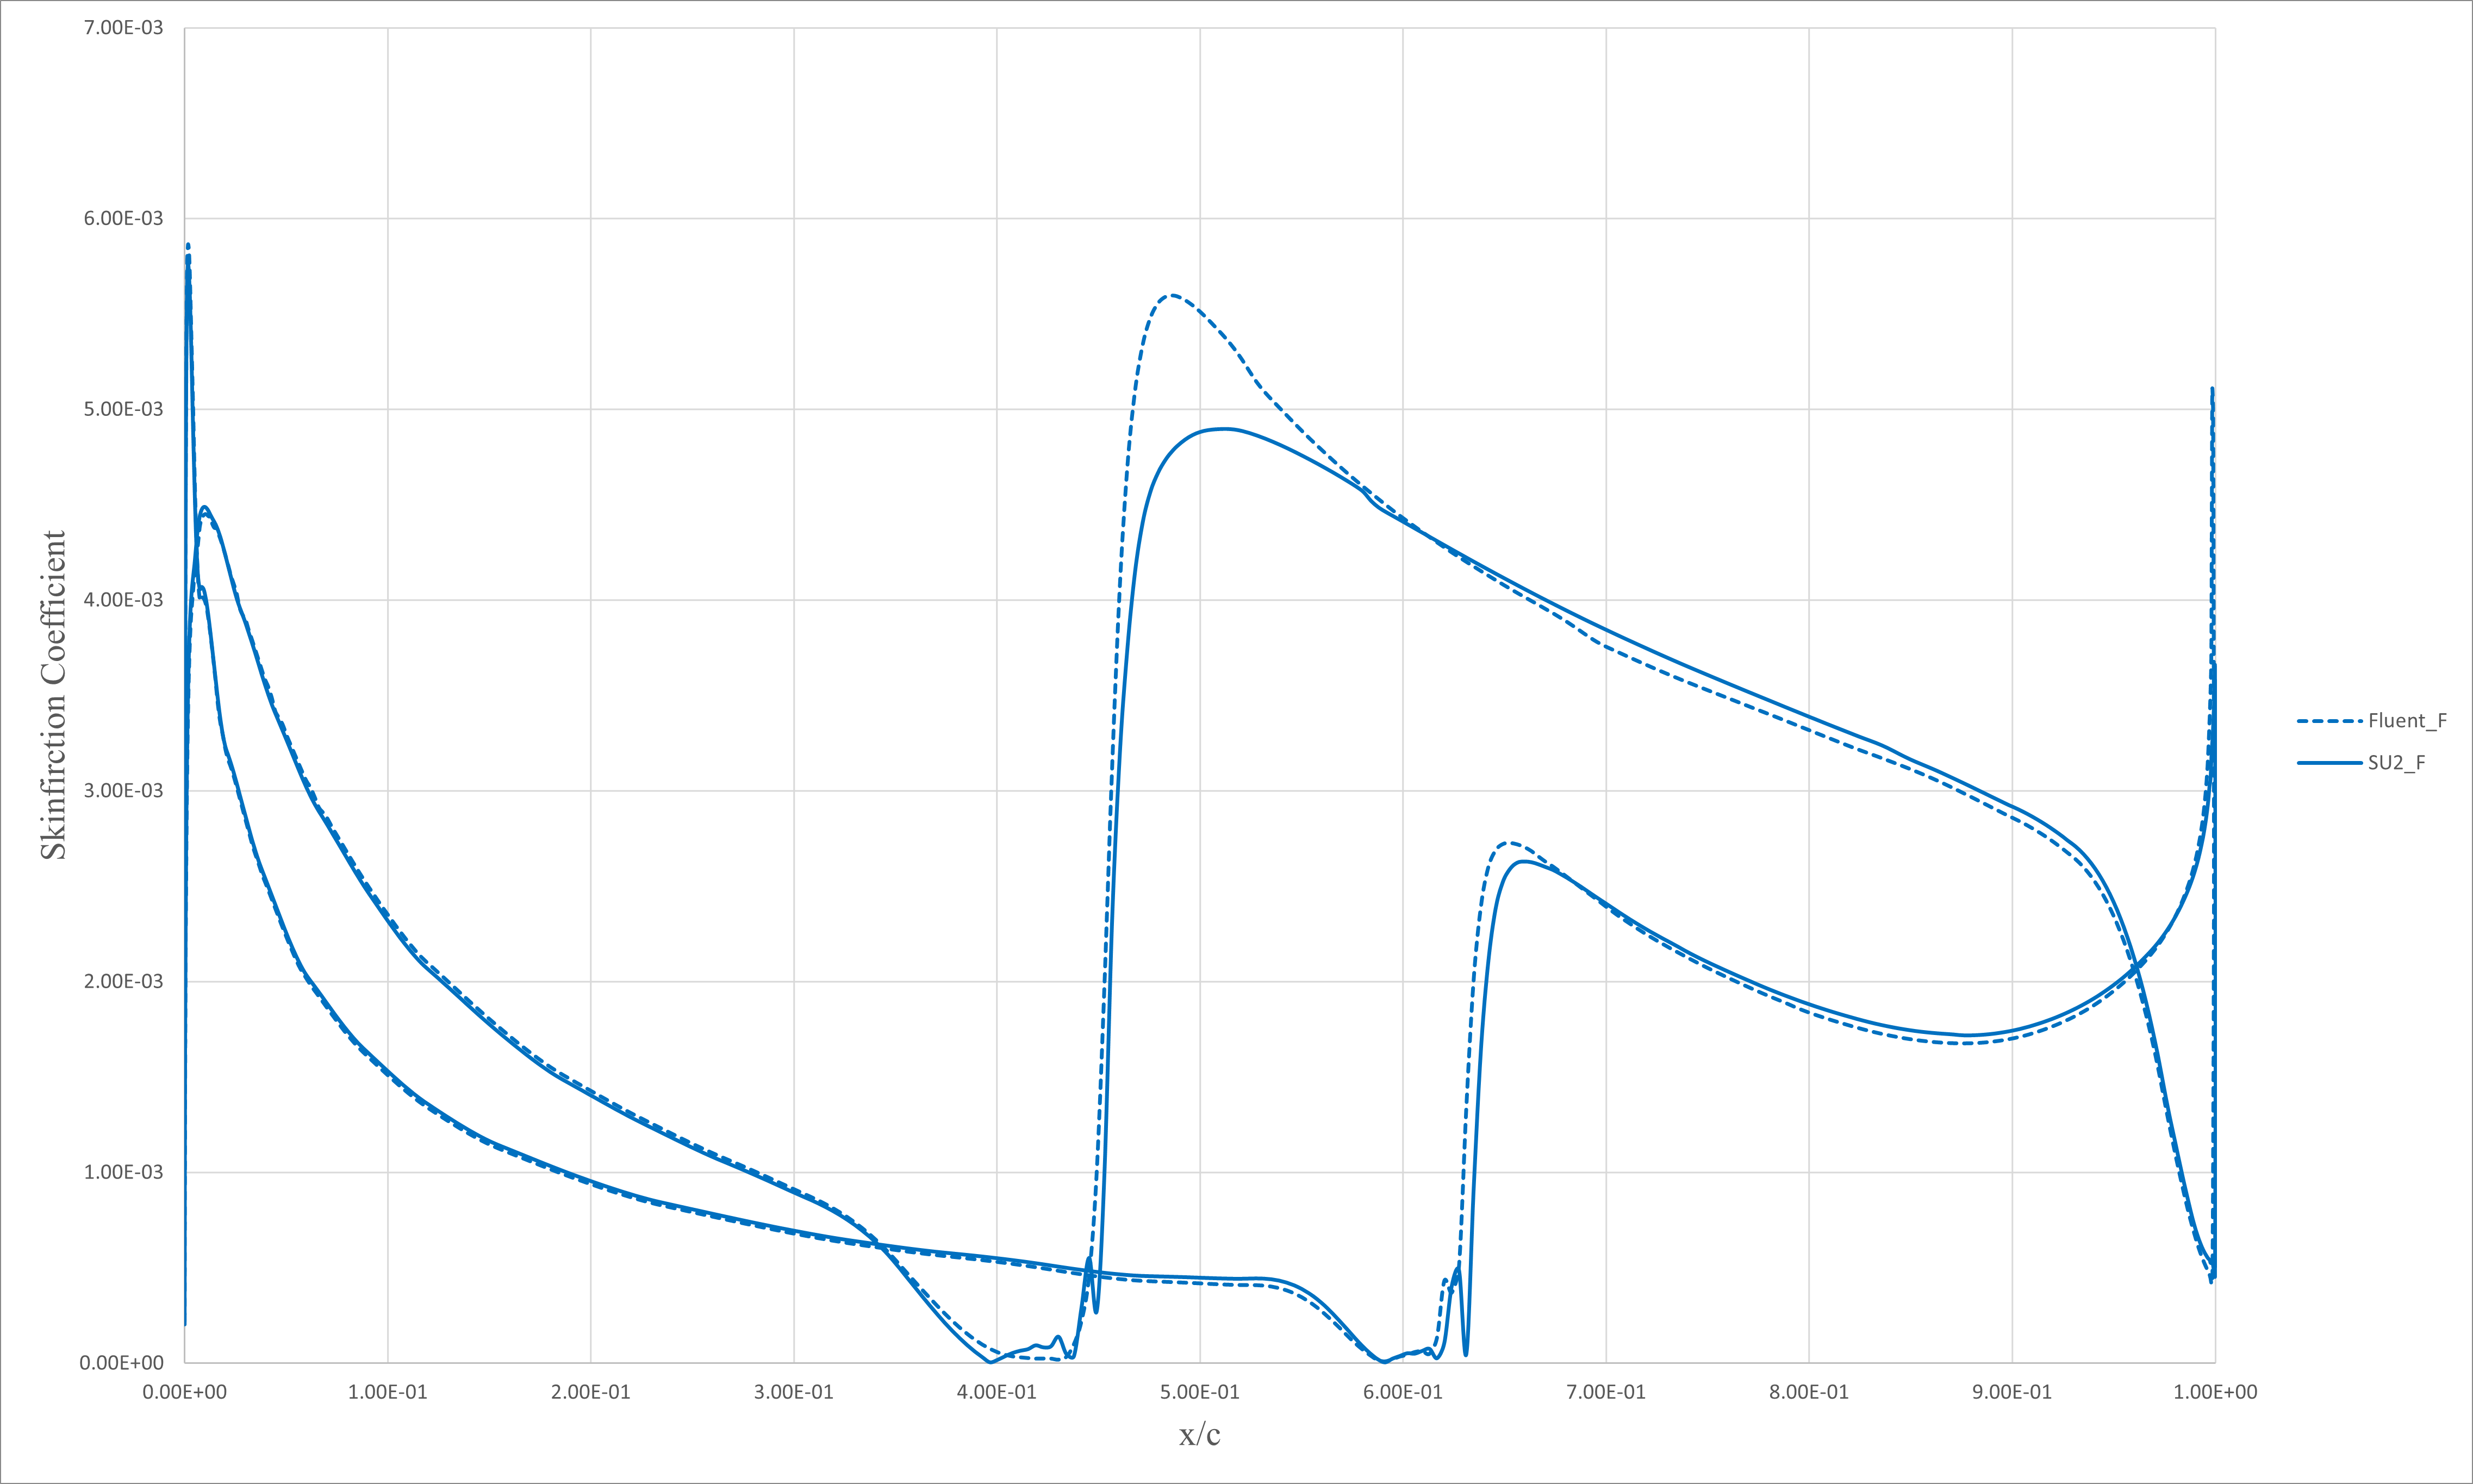
 ### NLF0416
Fluent and SU2, the NLF-0416 airfoil results oscillate near the separation region. So, Here are shown only the fine-level grid results of every 1000 iterations and the instantaneous.
C : Coarse
M : Medium
F : Fine
Every 1000 iteration results :
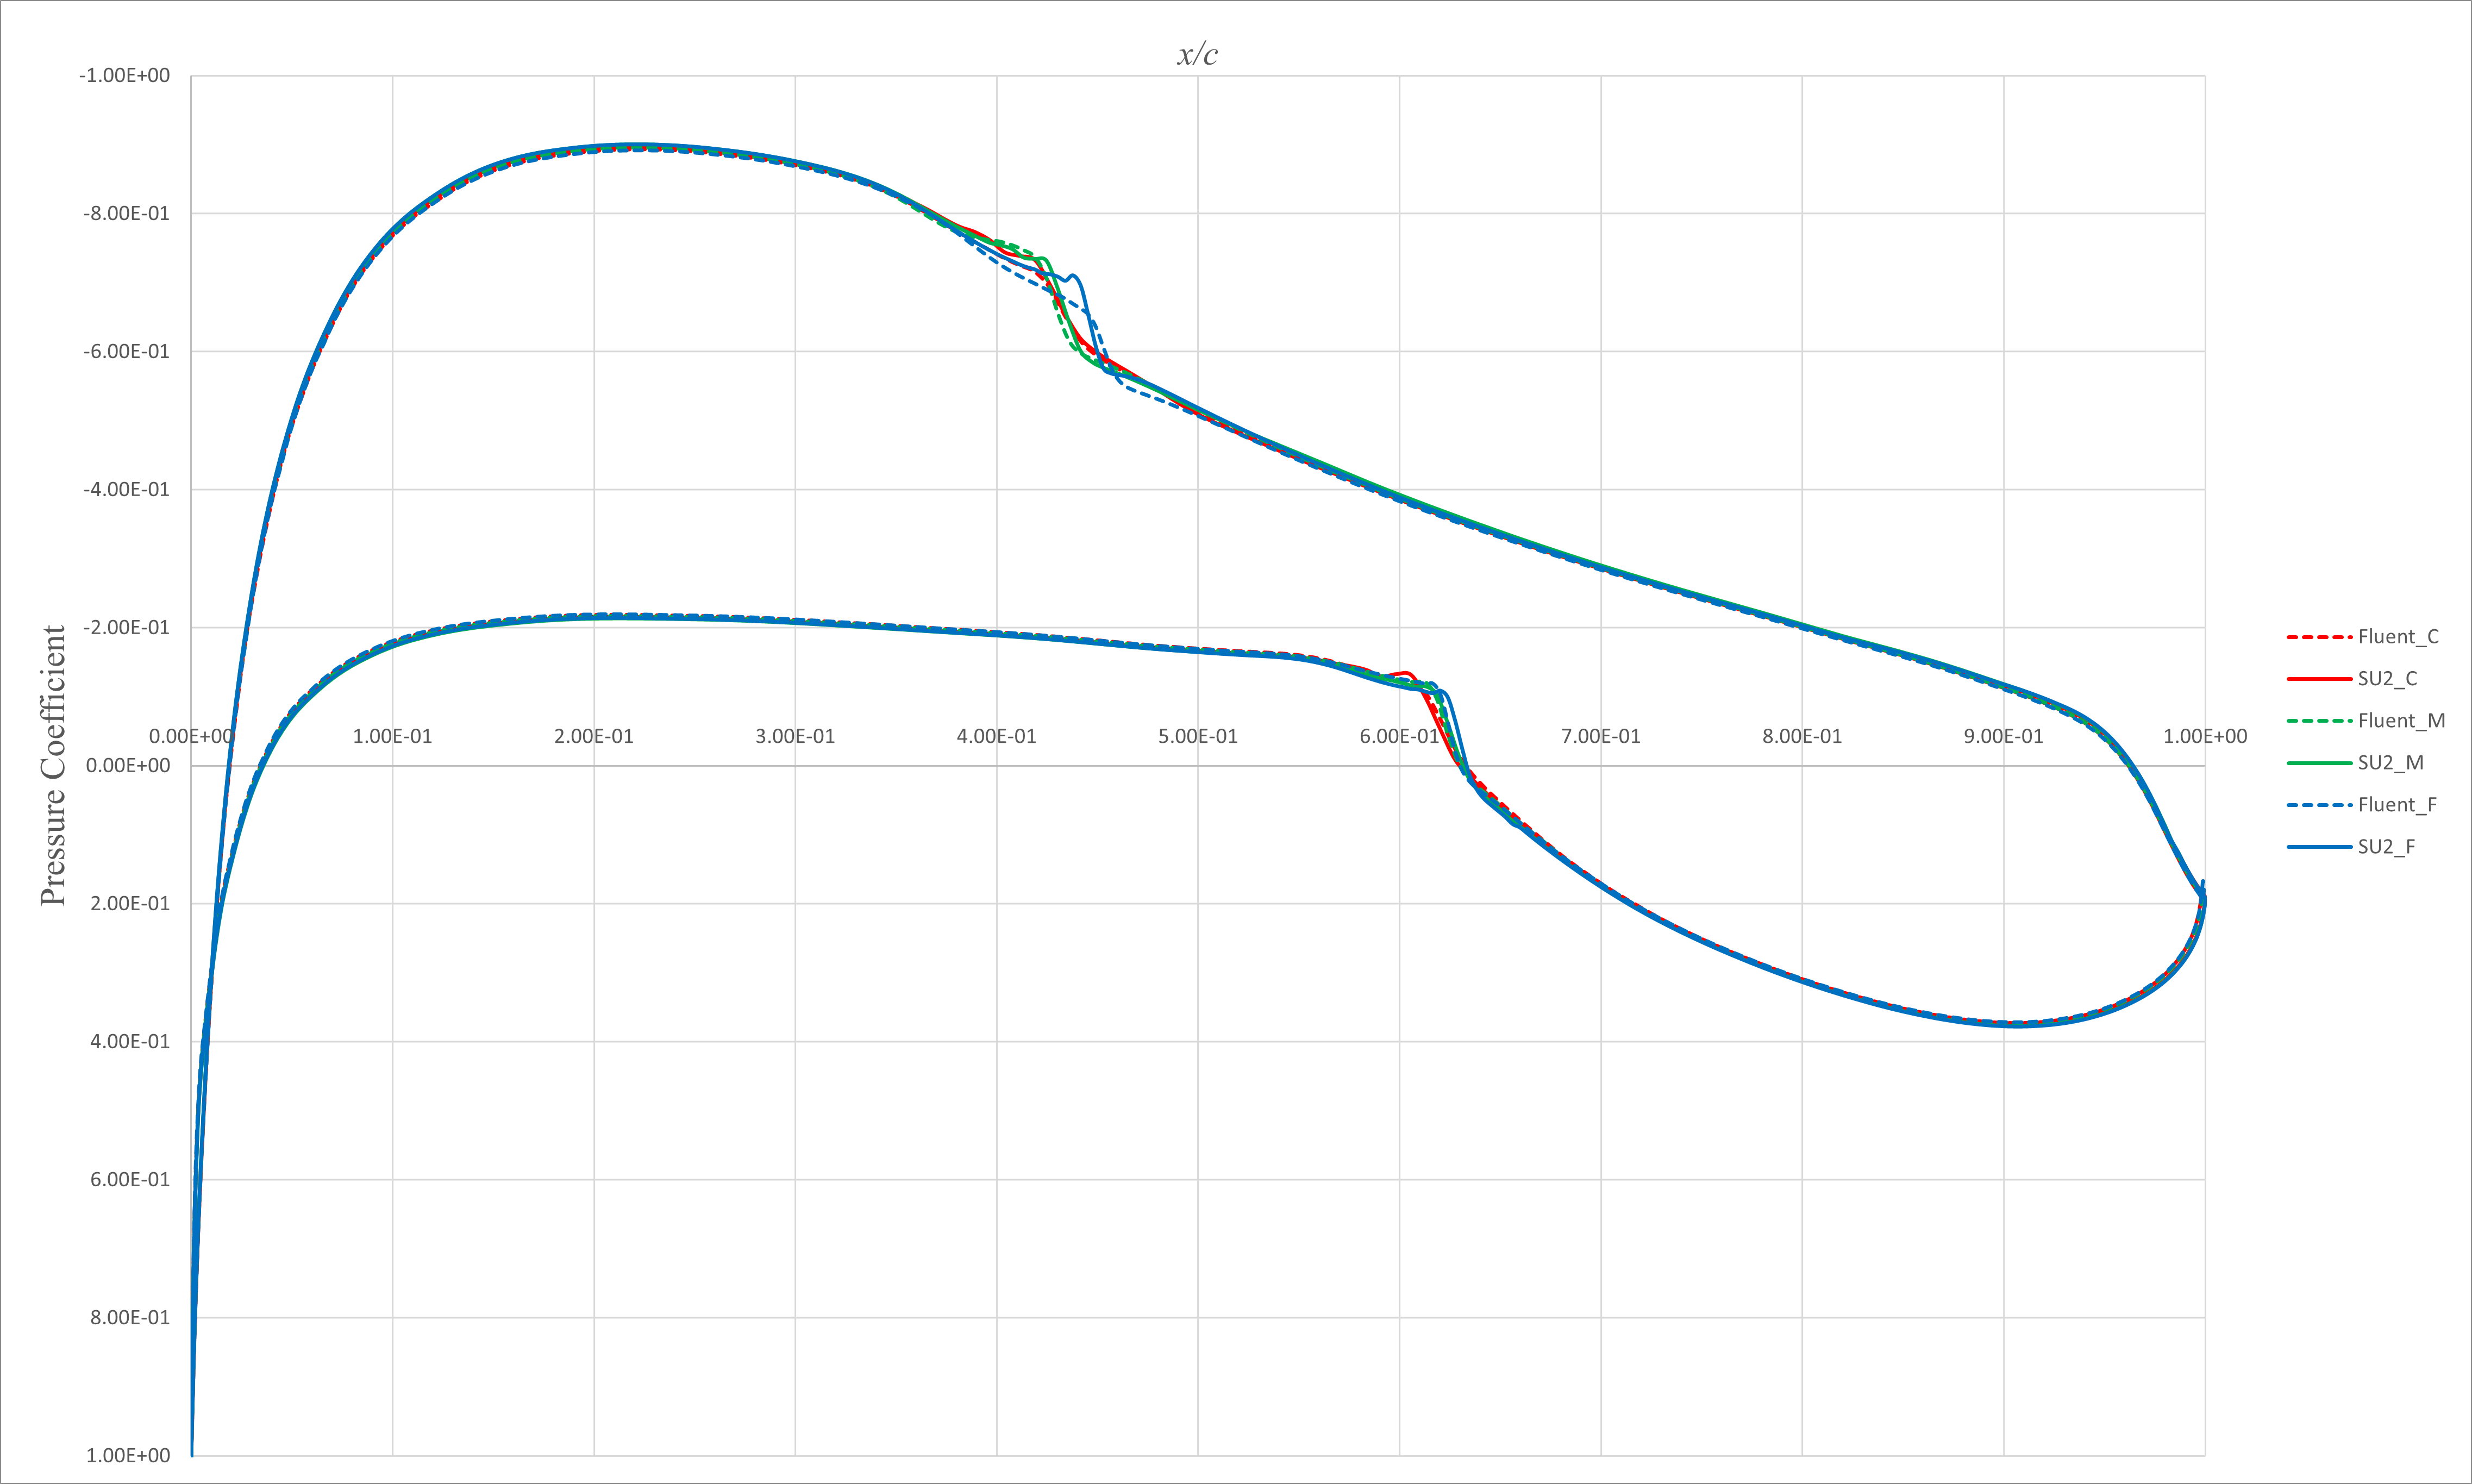
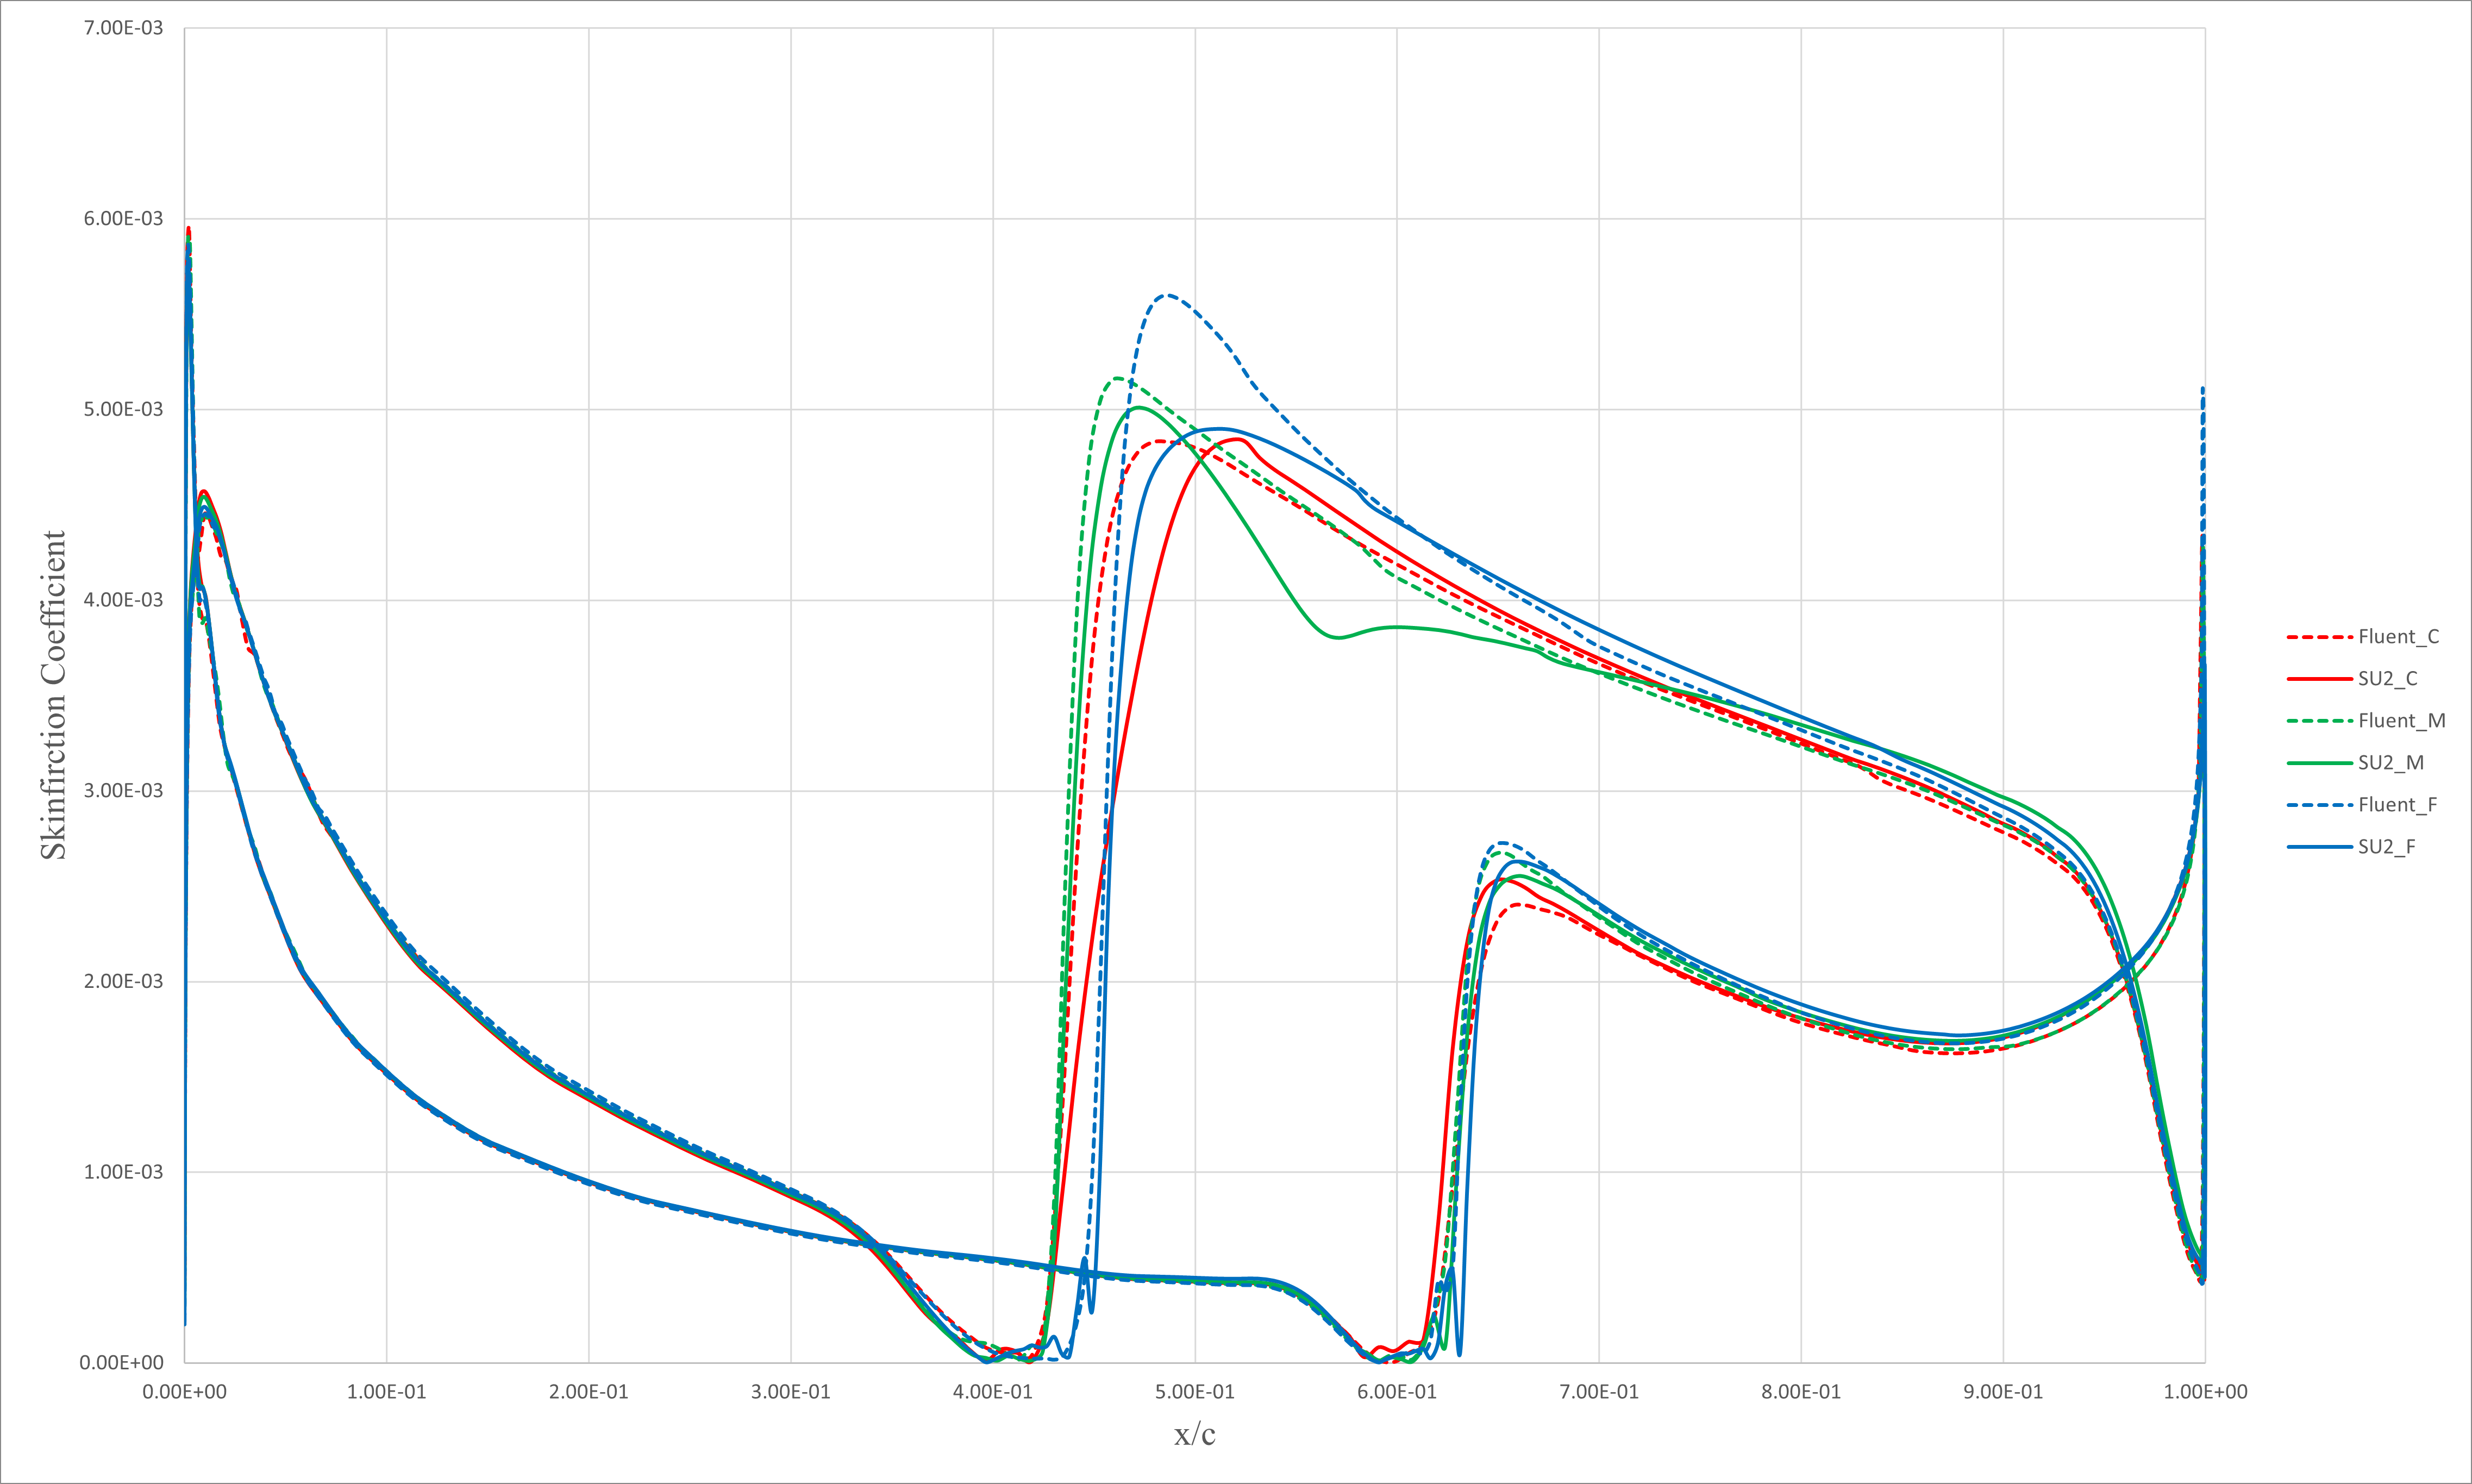
### NLF0416
Fluent and SU2, the NLF-0416 airfoil results oscillate near the separation region. So, Here are shown only the fine-level grid results of every 1000 iterations and the instantaneous.
C : Coarse
M : Medium
F : Fine
Every 1000 iteration results :
 Instantaneous result is :
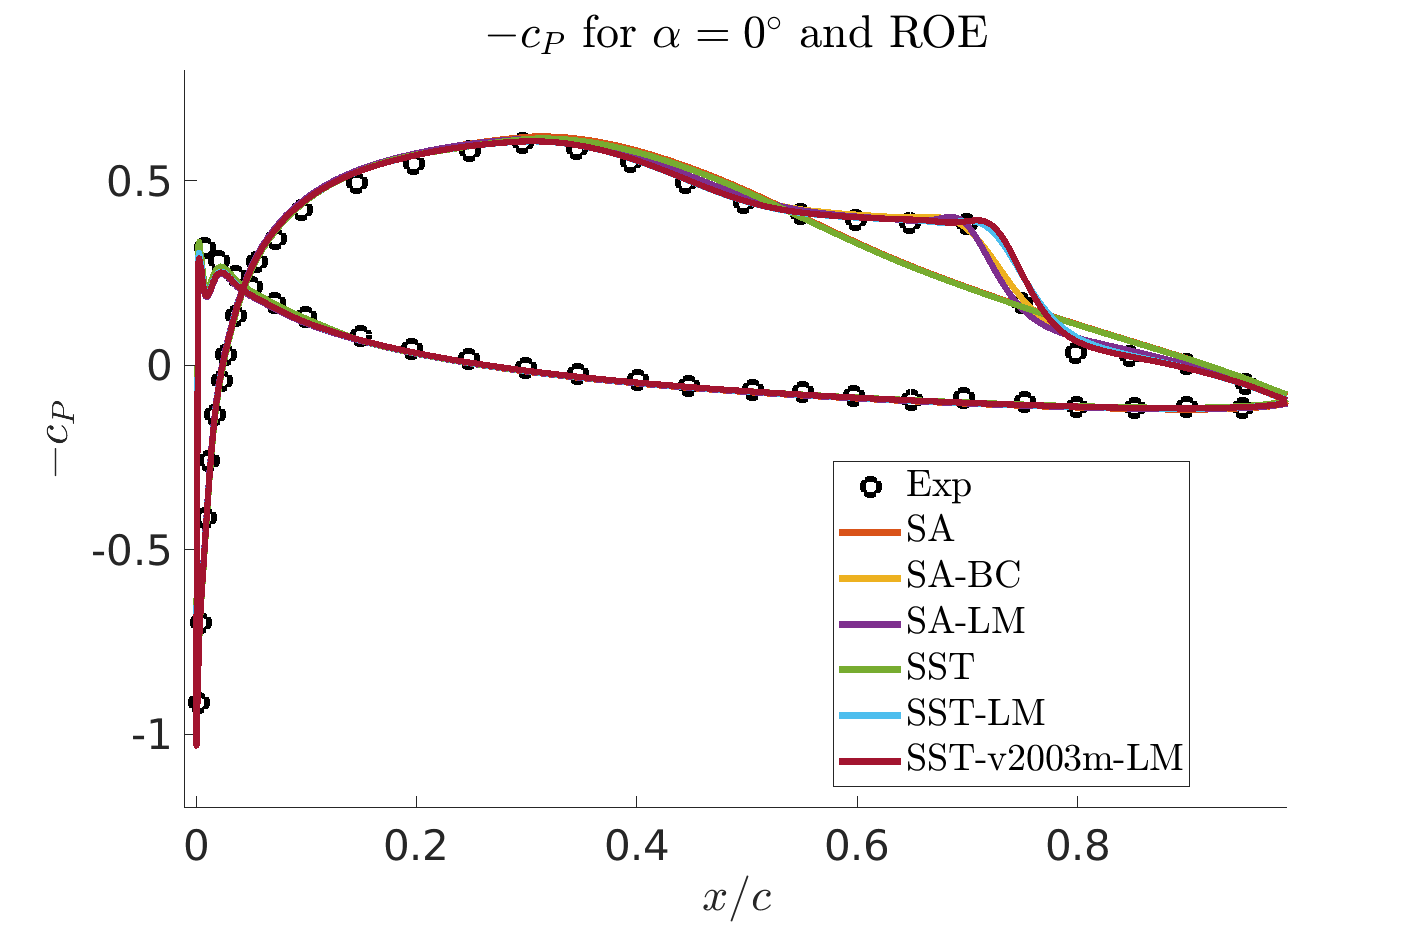
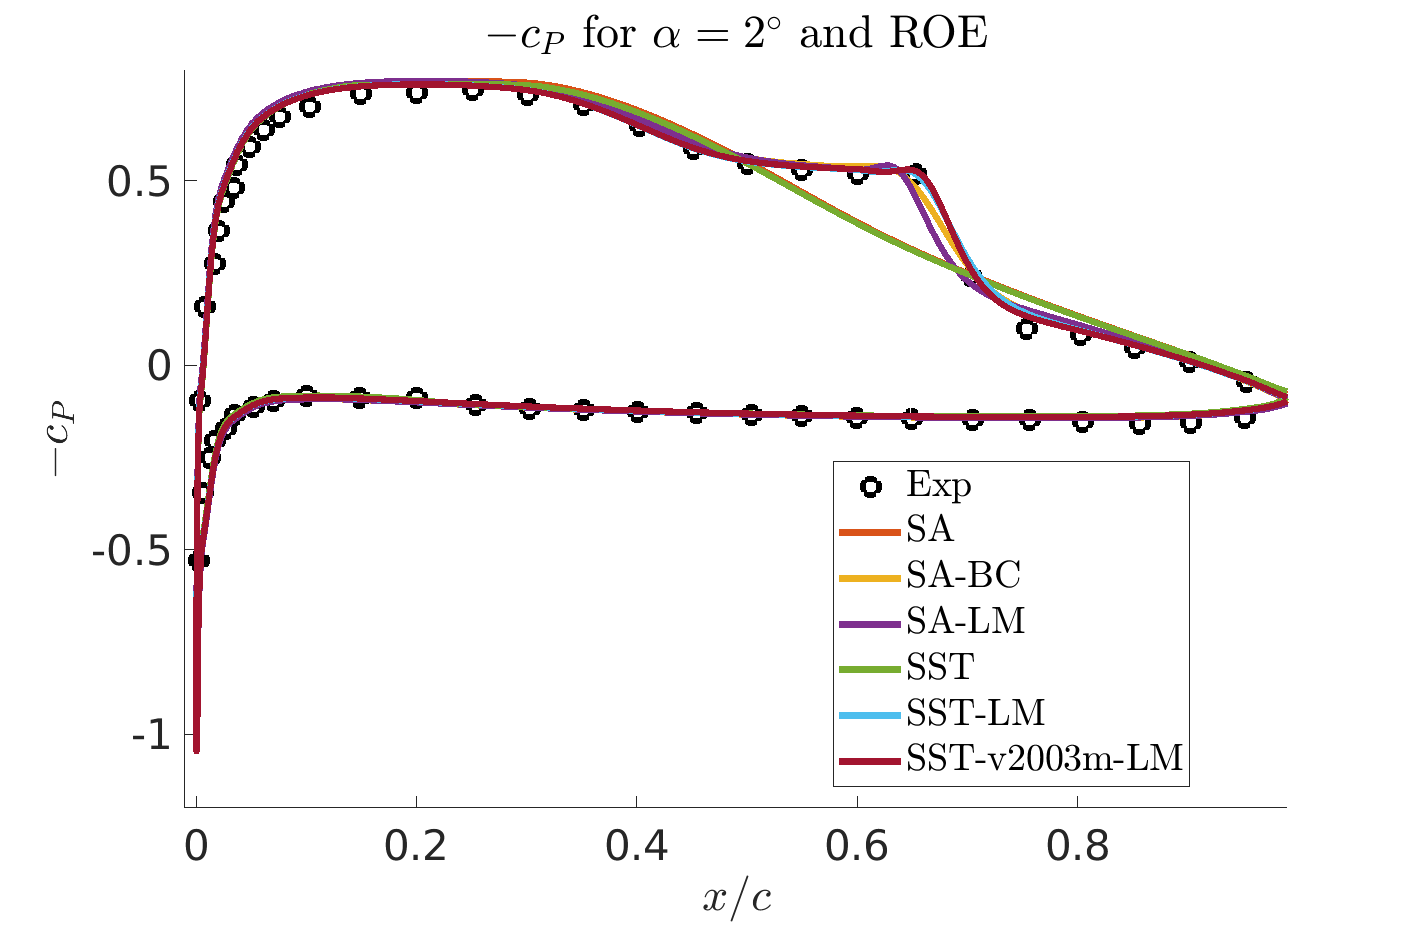
 ### E387
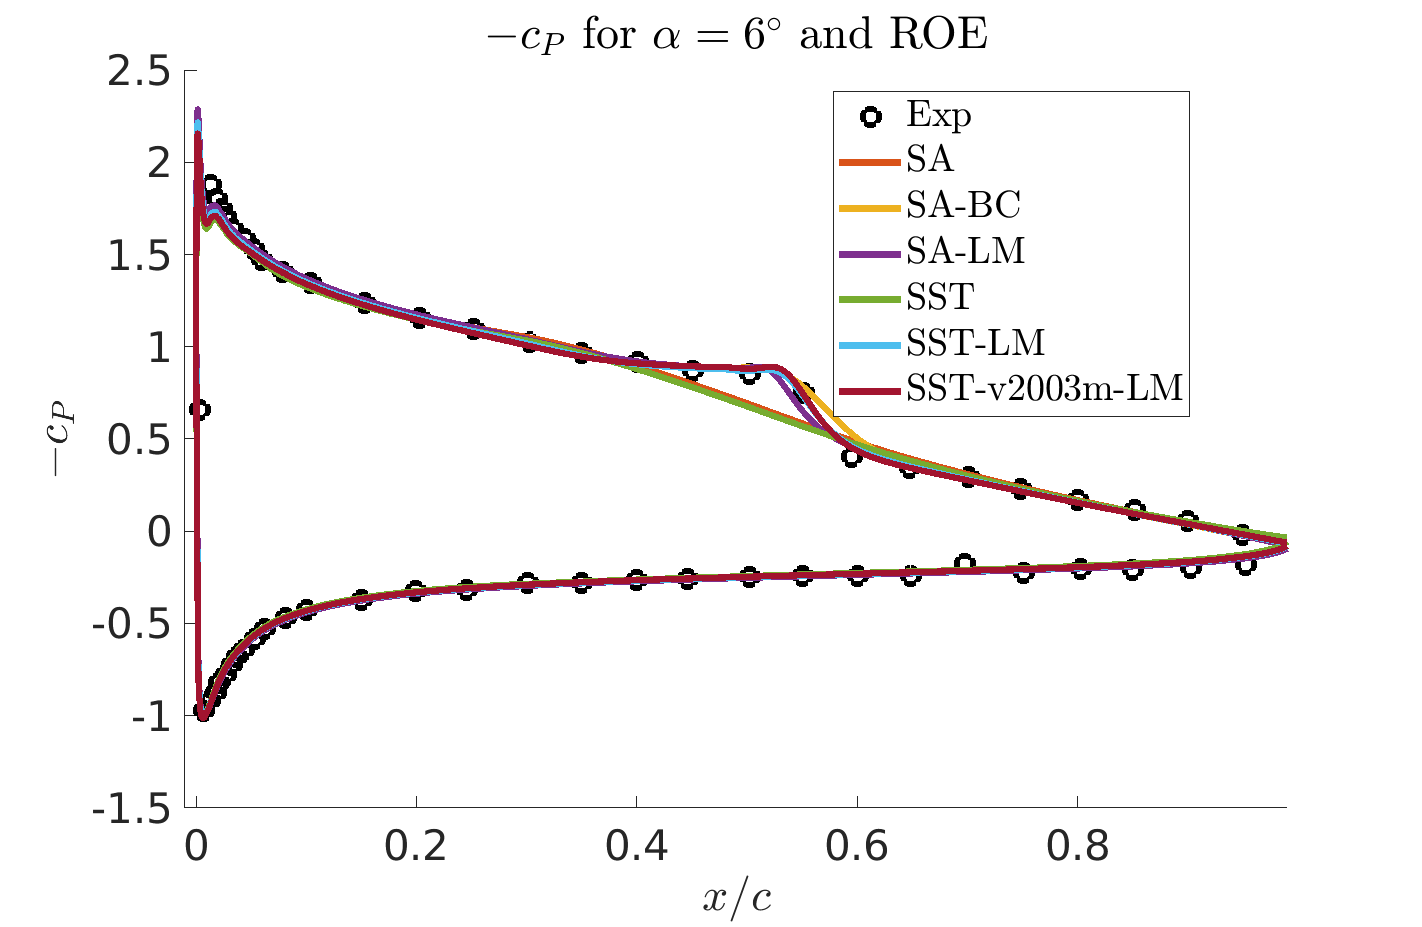
Experimental results are available. The pressure coefficient distribution has been compared for 4 angles of attack, namely 0deg, 2deg, 4deg, and 6deg. Cl-alpha and polar curves are also avaliable for comparison.
Pressure coefficient distribution obtained through ROE scheme.
### E387
Experimental results are available. The pressure coefficient distribution has been compared for 4 angles of attack, namely 0deg, 2deg, 4deg, and 6deg. Cl-alpha and polar curves are also avaliable for comparison.
Pressure coefficient distribution obtained through ROE scheme.

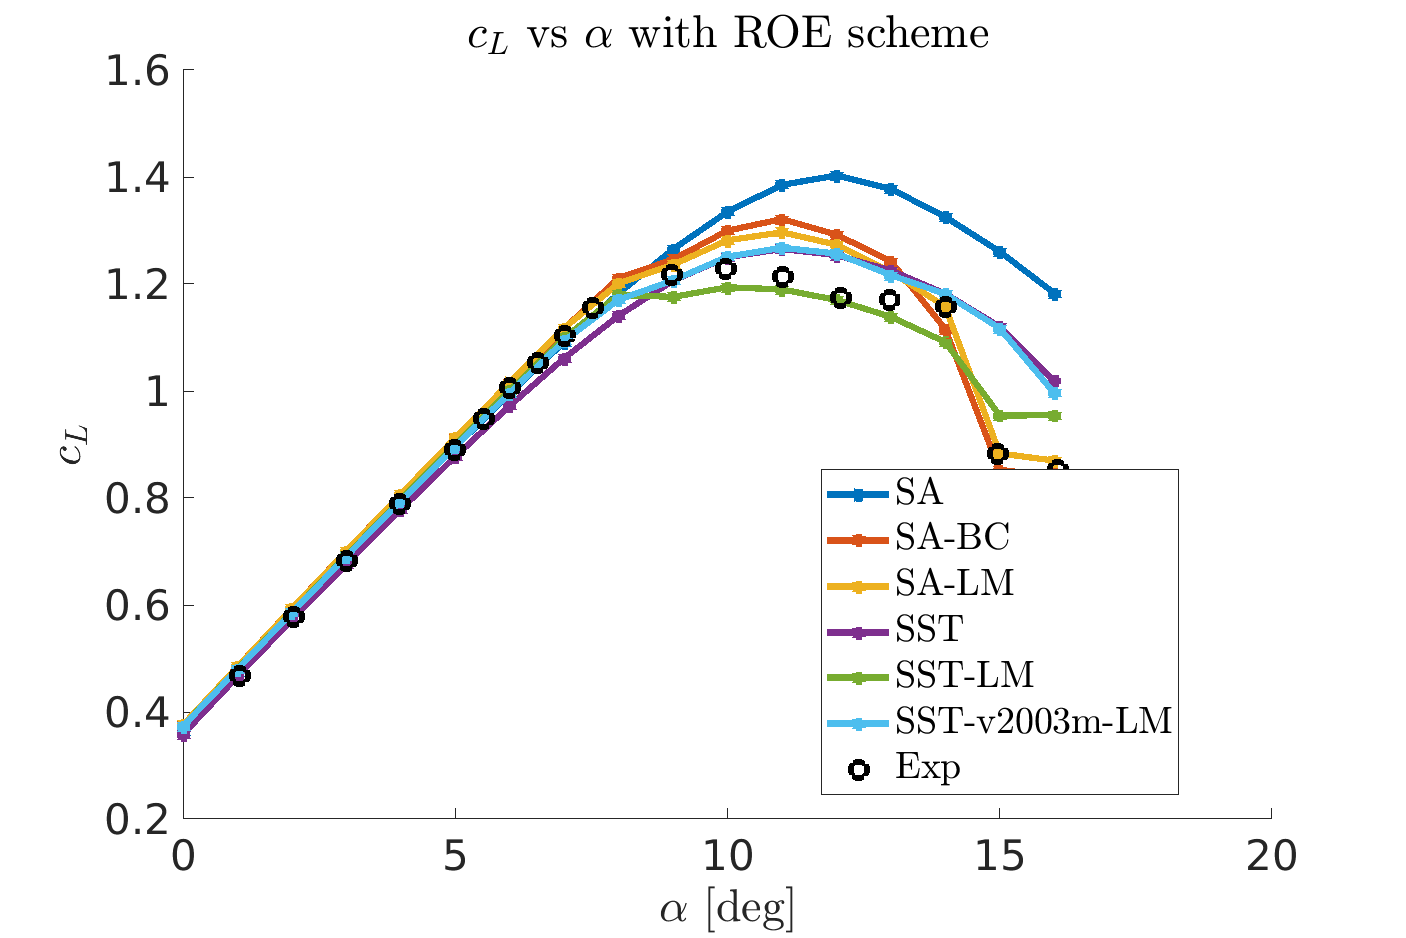
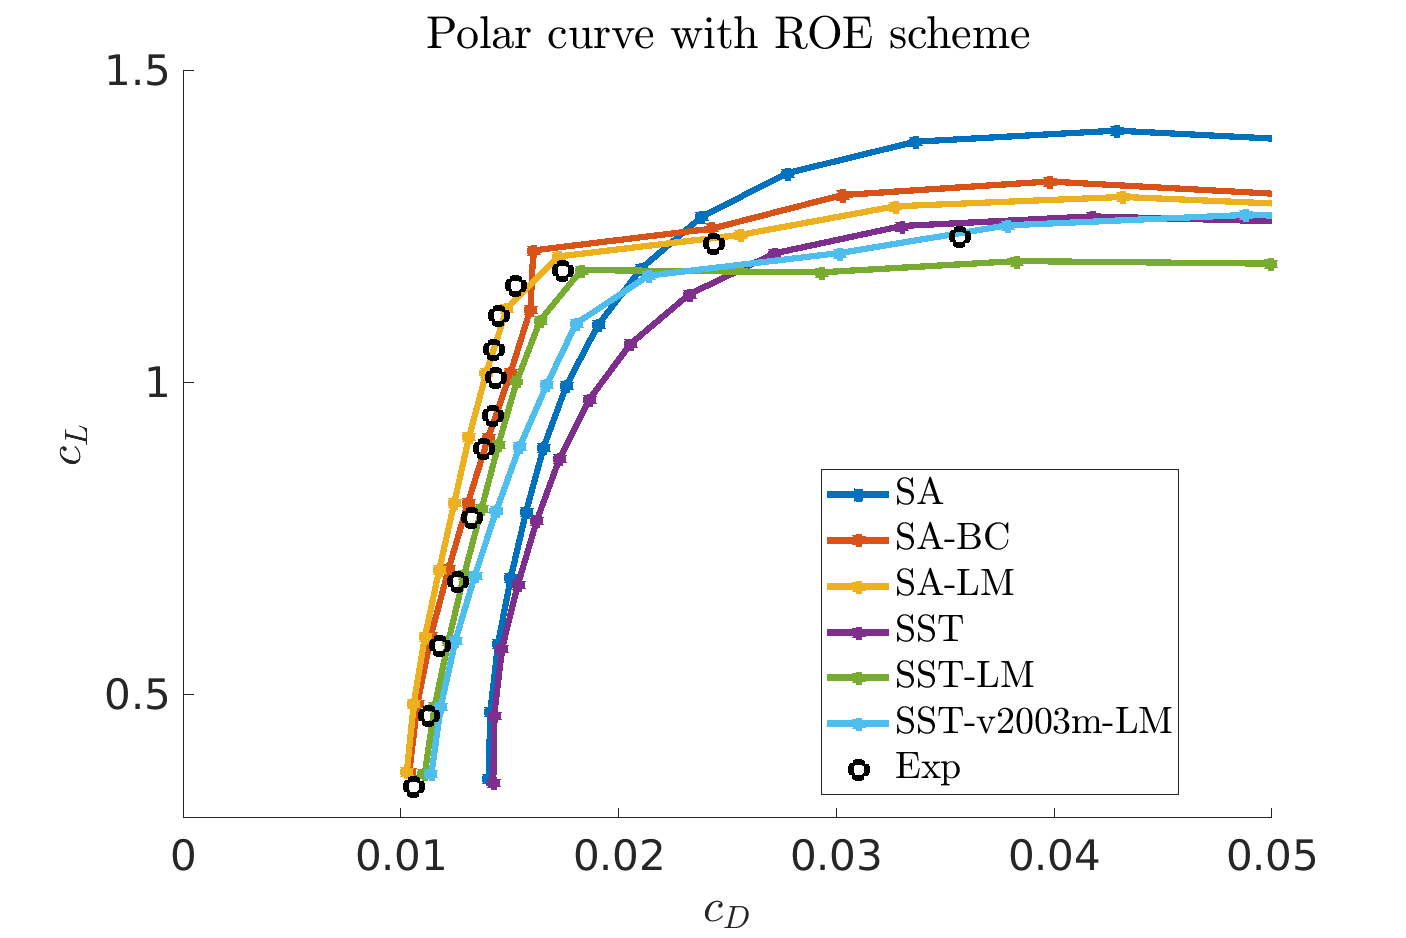
 Cl-alpha and polar curve obtained through ROE scheme.
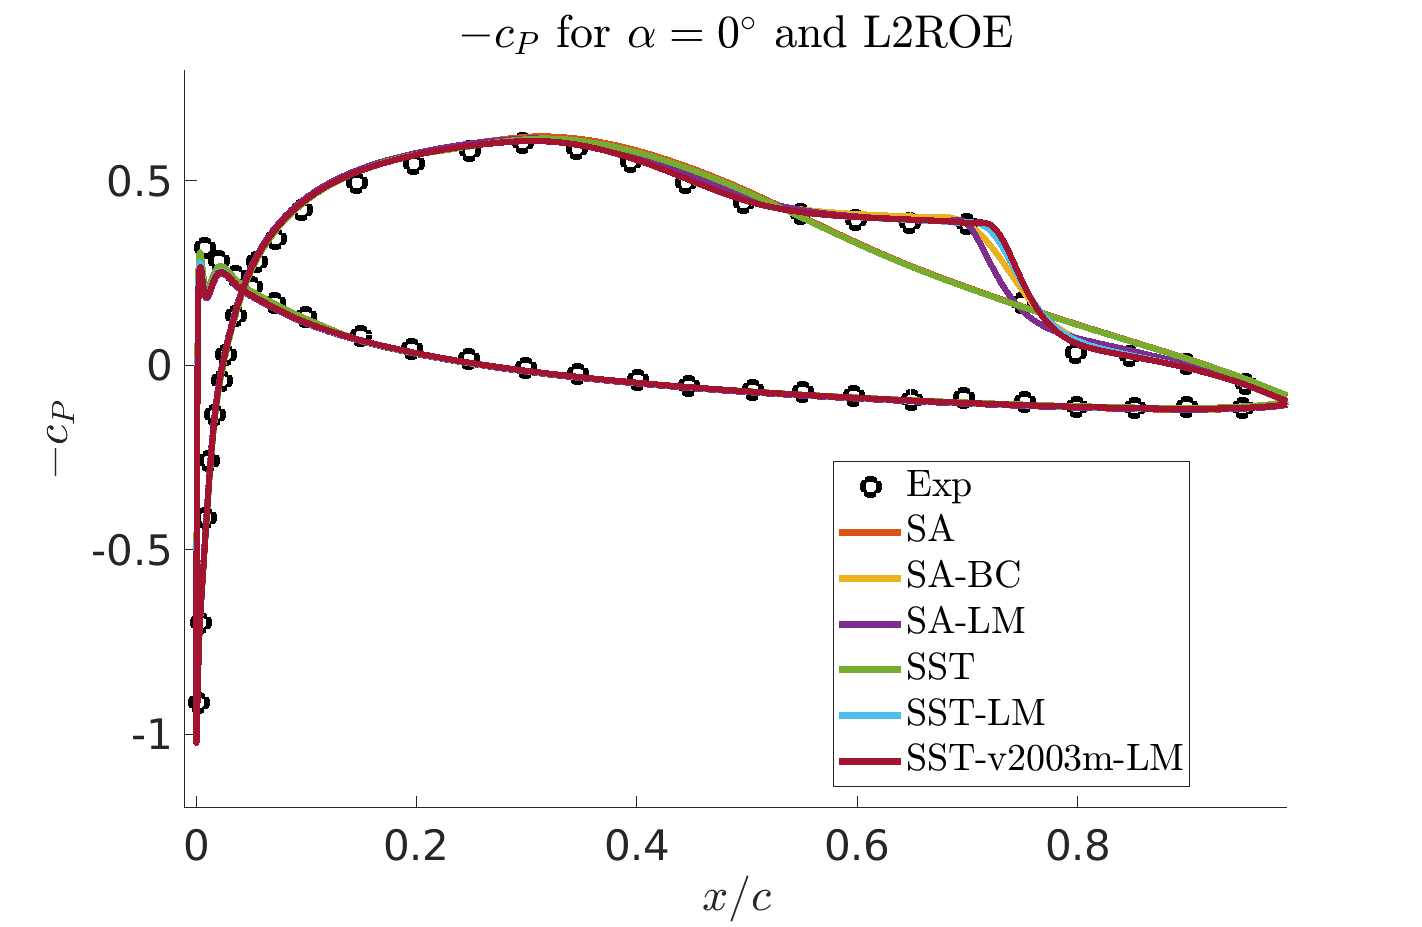
 Pressure coefficient distribution obtained through L2ROE scheme.
 Cl-alpha and polar curve obtained through L2ROE scheme.