-
Method of Manufactured Solutions for Compressible Navier-Stokes
2D Zero Pressure Gradient Flat Plate RANS Verification Case
2D Bump-in-Channel RANS Verification Case
Three-Element High-Lift Subsonic Airfoil
Shock-Wave Boundary-Layer Interaction
Langtry and Menter transition model
2D DSMA661 Airfoil Near-Wake RANS Verification Case
Shock-Wave Boundary-Layer Interaction
| Solver | Version | Author |
|---|---|---|
RANS |
7.4.0 | P. Gomes |
The details of the Mach 5 SWBLI validation case are taken from the NPARC Alliance Validation Archive.
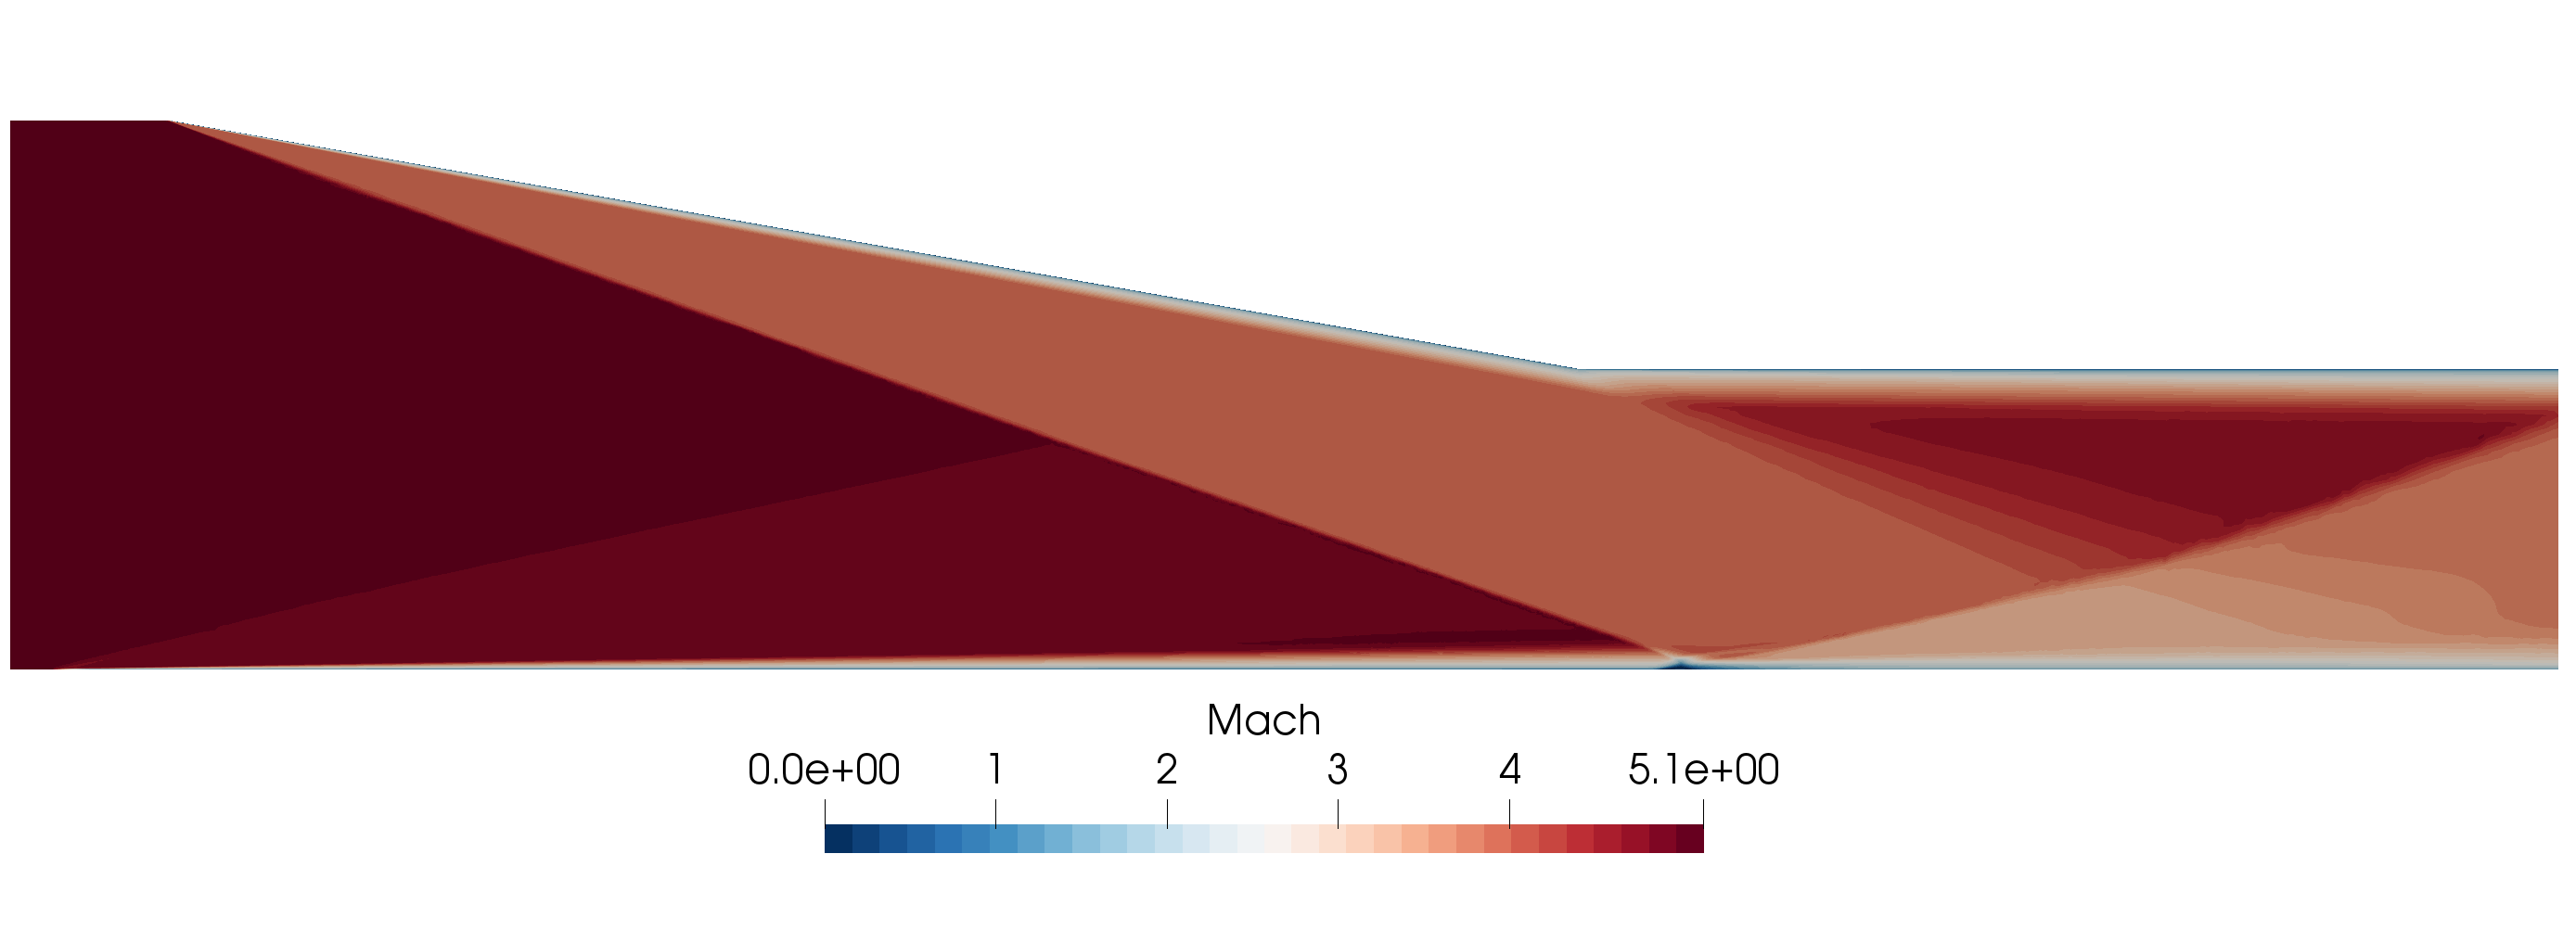
Figure 1 - Mach number contours (SST-2003m).
We validate our implementation of the SA and SST models by comparing the SU2 numerical results on a sequence of grids against experimental results.
Problem Setup
The main geometry features and flow conditions are according to the main reference. In this study, the inlet was extended 10mm to avoid the intersection of the supersonic inlet with a no-slip wall (that extension is modelled with a slip wall). The SU2 configuration files used in this study are available here. These are applicable to all grid levels, however note that simulations on finer grids were restarted from the results on the previous (coarser) level. Mean flow convective fluxes were computed with Roe’s scheme and a limited MUSCL reconstruction (Green-Gauss gradients and Venkatakrishnan’s limiter). The SA-neg and SST-2003m turbulence models were used with first order advection. SU2 was run with “freestream equal Mach” non-dimensionalization for all configurations.
Mesh Description
Quad-dominant meshes of increasing density were used to perform a grid convergence study. The meshes were generated using GMSH where a refinement factor was applied for all sizes and counts. Particular attention was given to the y+ on the bottom plate (smaller than 1 on the coarsest level), the main shock, and the separation region. The GMSH script can be downloaded from the SU2 V&V GitHub repository. The mesh designations and approximate sizes are:
- L1 “coarse” (2 x “fine”) - 37k quadrilaterals
- L2 “medium” (1.41 x “fine”) - 76k quadrilaterals
- L3 “fine” - 146k quadrilaterals
Results
Given the focus of this validation case (interaction between a shock wave and a boundary layer) it is of particular interest to analyze how well CFD predicts the skin friction coefficient on the bottom plate and the separation (caused by the shock wave) and re-attachment locations. Figure 2 compares the skin friction coefficient for the two turbulence models and three mesh levels used, with the experimental values.
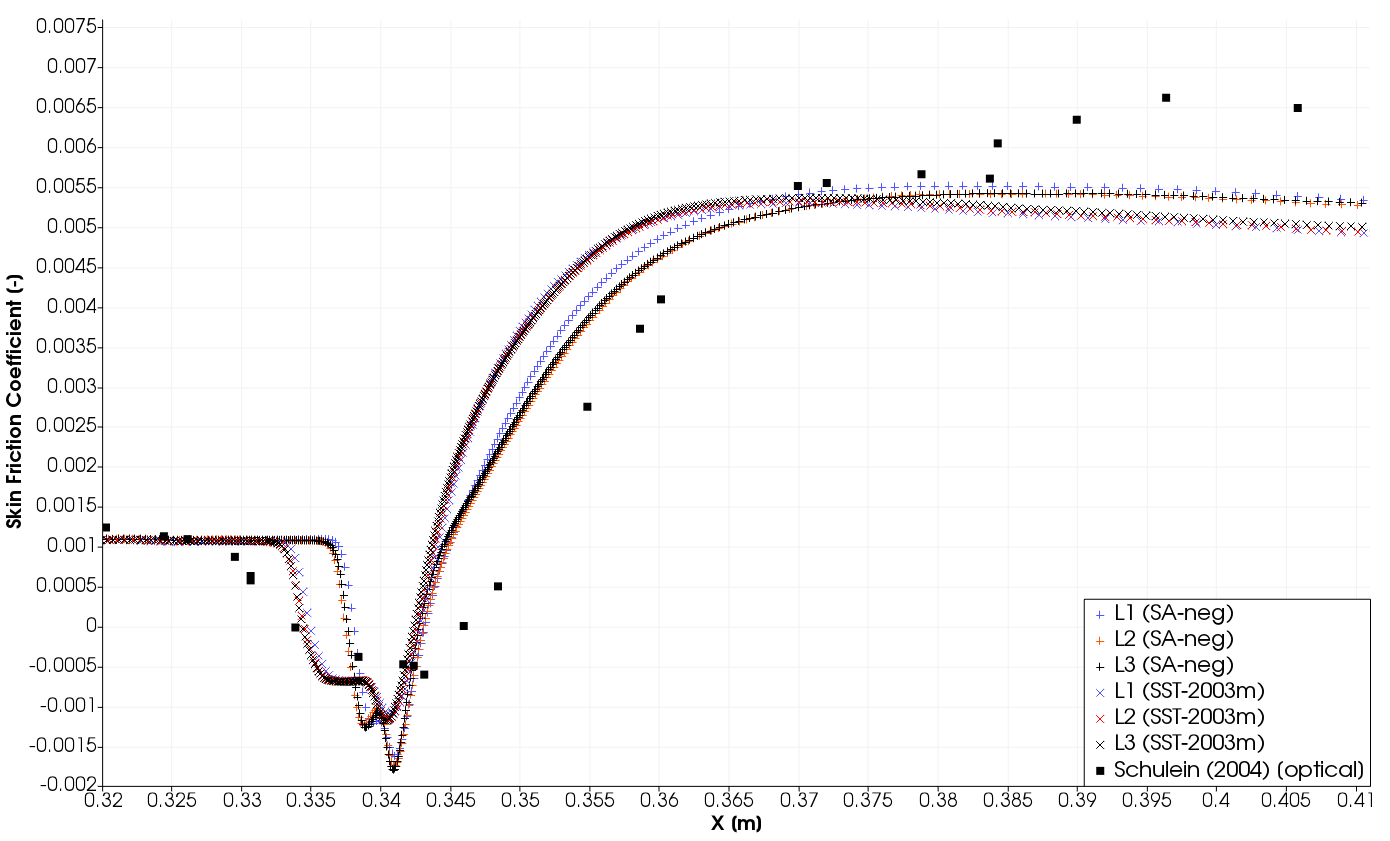
Figure 2 - Comparison of skin friction coefficient.
The results do not change significantly between meshes L2 and L3, they were also not sensitive to other perturbations such as refining the mesh around the main shock, or global refinement (i.e. what would be an L4 mesh). The results for these other tests are omitted for simplicity.
Both turbulence models predict that separation takes place (negative skin friction). The start of the separation region is better predicted with SST and it is close to the experiment. However, both models underestimate the re-attachment location.
These results with SU2 are further from the experiment than the numerical results presented in the main reference, which is likely due to compressibility effects not being included in the SA and SST-2003m models.
This hypothesis was tested by including the SA mixing-layer compressibility correction, i.e. using SA-neg-comp (by adding COMPRESSIBILITY to SA_OPTIONS).
Figure 3 compares the results obtained with this model on meshes L2 and L3 with the experimental results, the SA-neg results on the L3 mesh are also shown for reference.
With compressibility effects the size of the separation region is closer to the experiment.
This V&V case will be updated with results from the SST-2003 (not modified) model once it is implemented.
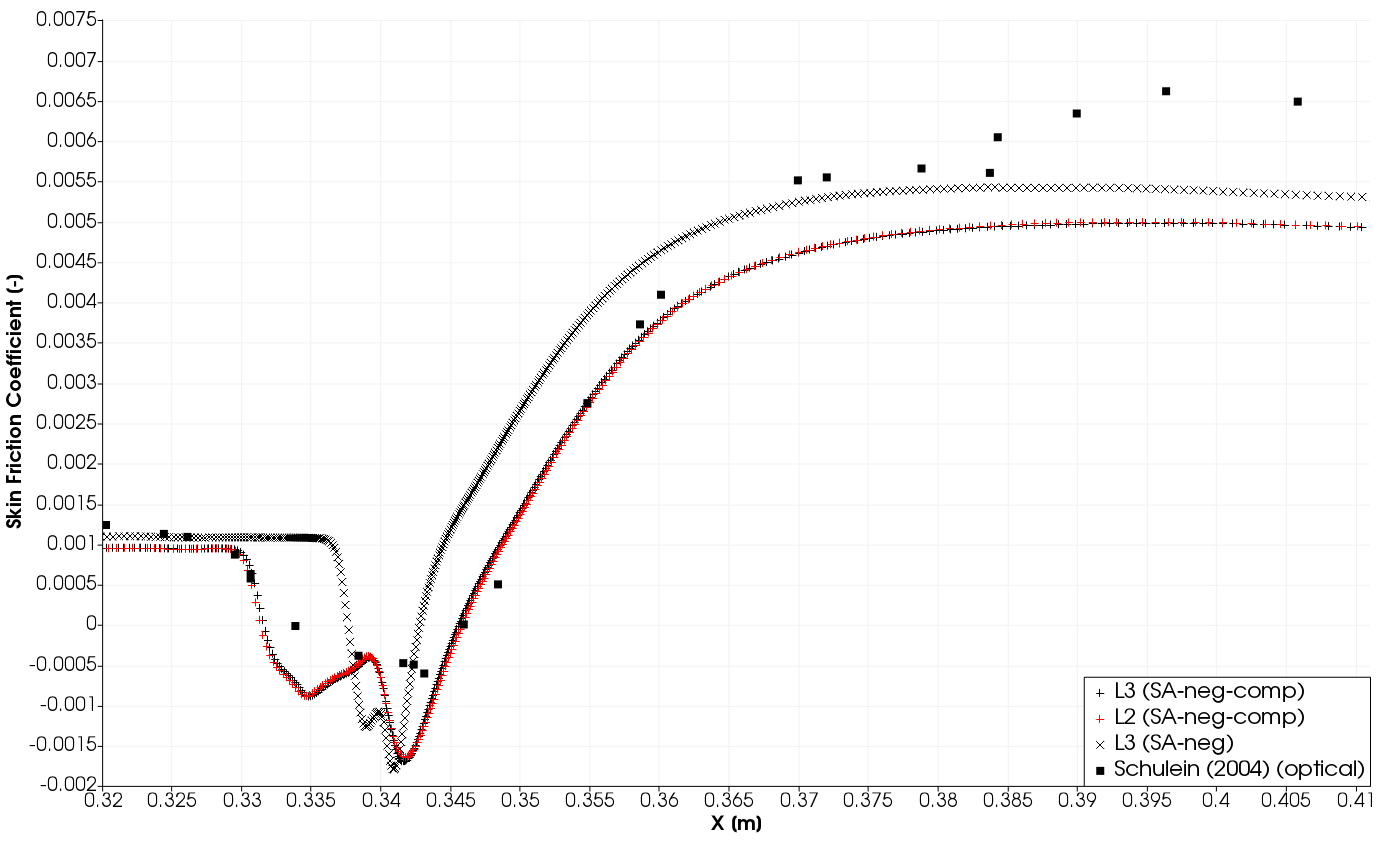
Figure 3 - Skin friction coefficient with SA compressibility correction.