-
Method of Manufactured Solutions for Compressible Navier-Stokes
2D Zero Pressure Gradient Flat Plate RANS Verification Case
2D Bump-in-Channel RANS Verification Case
Three-Element High-Lift Subsonic Airfoil
Shock-Wave Boundary-Layer Interaction
Langtry and Menter transition model
2D DSMA661 Airfoil Near-Wake RANS Verification Case
NACA 0021 Beyond Stall: Hybrid RANS/LES
| Solver | Version | Author |
|---|---|---|
INC_RANS |
8.5.0 with PR #2150 | A. Rausa |
This case compares four hybrid RANS/LES models of SU2 on a NACA 0021 airfoil at 60 degrees angle of attack. At this angle the flow separates at the leading and trailing edges. A wide, unsteady wake forms behind the airfoil. URANS does not predict this flow well, so it is a standard test for DES-type models. It is case UFR 2-11 of the ERCOFTAC knowledge base and a test case of the European DESider project.
The four models are:
| Run | Options | Cell size in LES mode |
|---|---|---|
| SA-DDES | KIND_TURB_MODEL= SA, HYBRID_RANSLES= SA_DDES |
Longest edge from the node (Δmax) |
| SA-EDDES | KIND_TURB_MODEL= SA, HYBRID_RANSLES= SA_EDDES |
Shear-layer-adapted (Δ_SLA) |
| SST-DDES | KIND_TURB_MODEL= SST, HYBRID_RANSLES= SST_DDES |
Longest edge from the node (Δmax) |
| SST-EDDES | KIND_TURB_MODEL= SST, HYBRID_RANSLES= SST_EDDES |
Shear-layer-adapted (Δ_SLA) |
The shear-layer-adapted cell size of Shur et al. (2015) is smaller than Δmax in the thin shear layers that leave the airfoil. The model then switches to LES faster after separation, and resolved eddies appear earlier. This is the main difference that the case shows. The models are explained on the Hybrid RANS/LES page.
Note: the SST variants and the current form of SA_EDDES come with PR #2150. They are in develop once that pull request is merged.
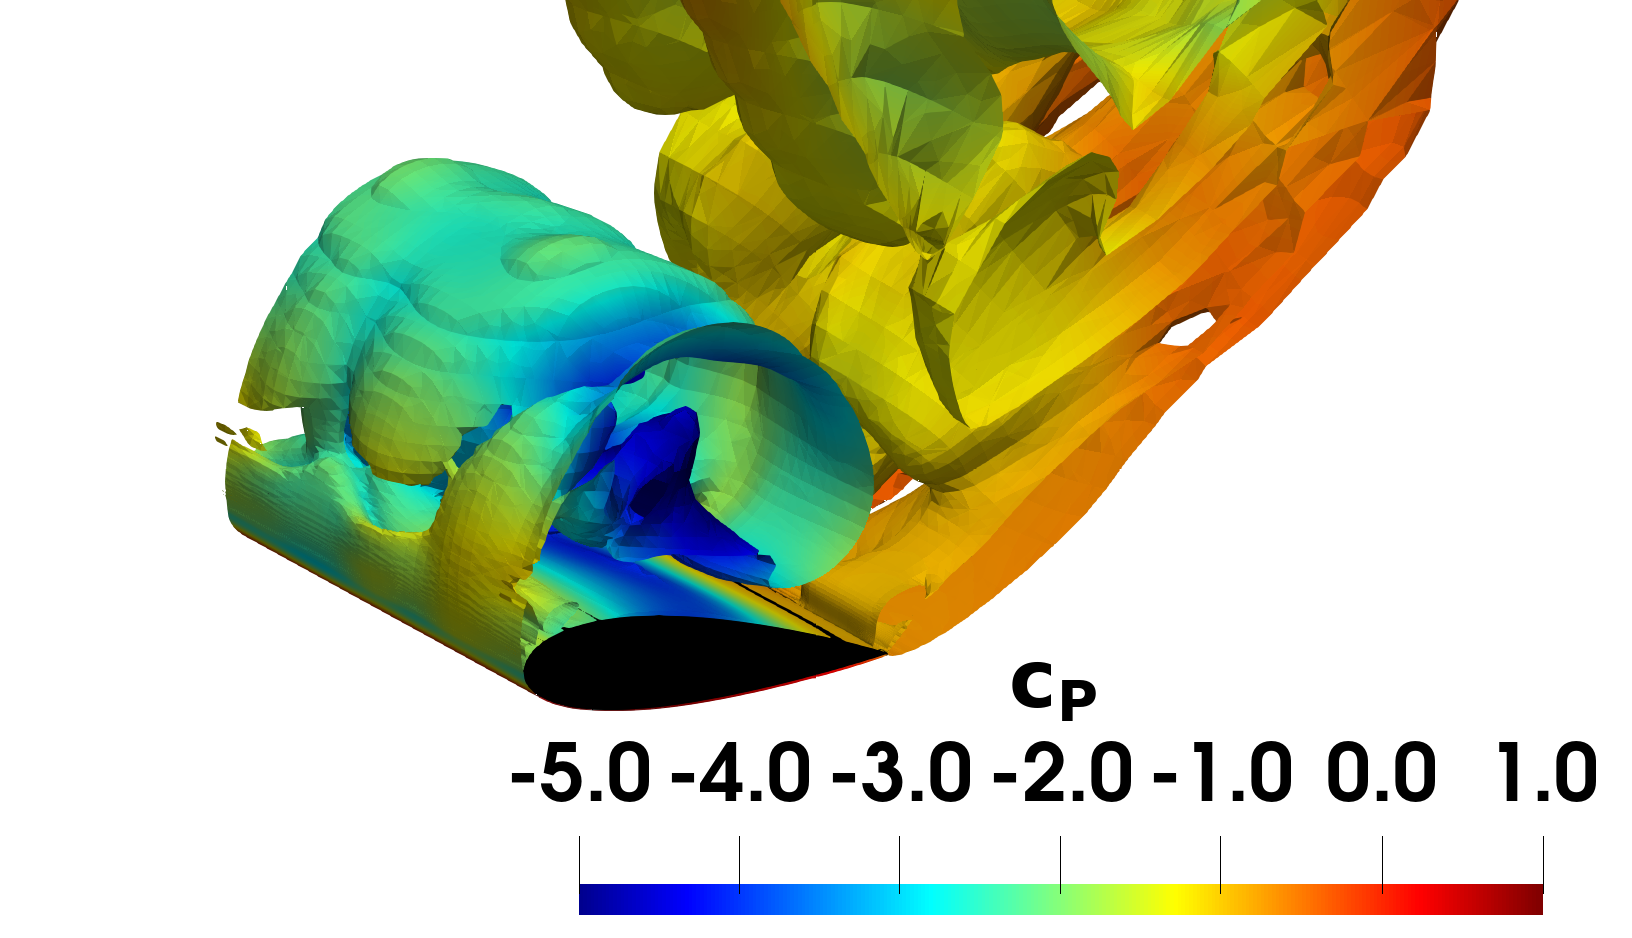
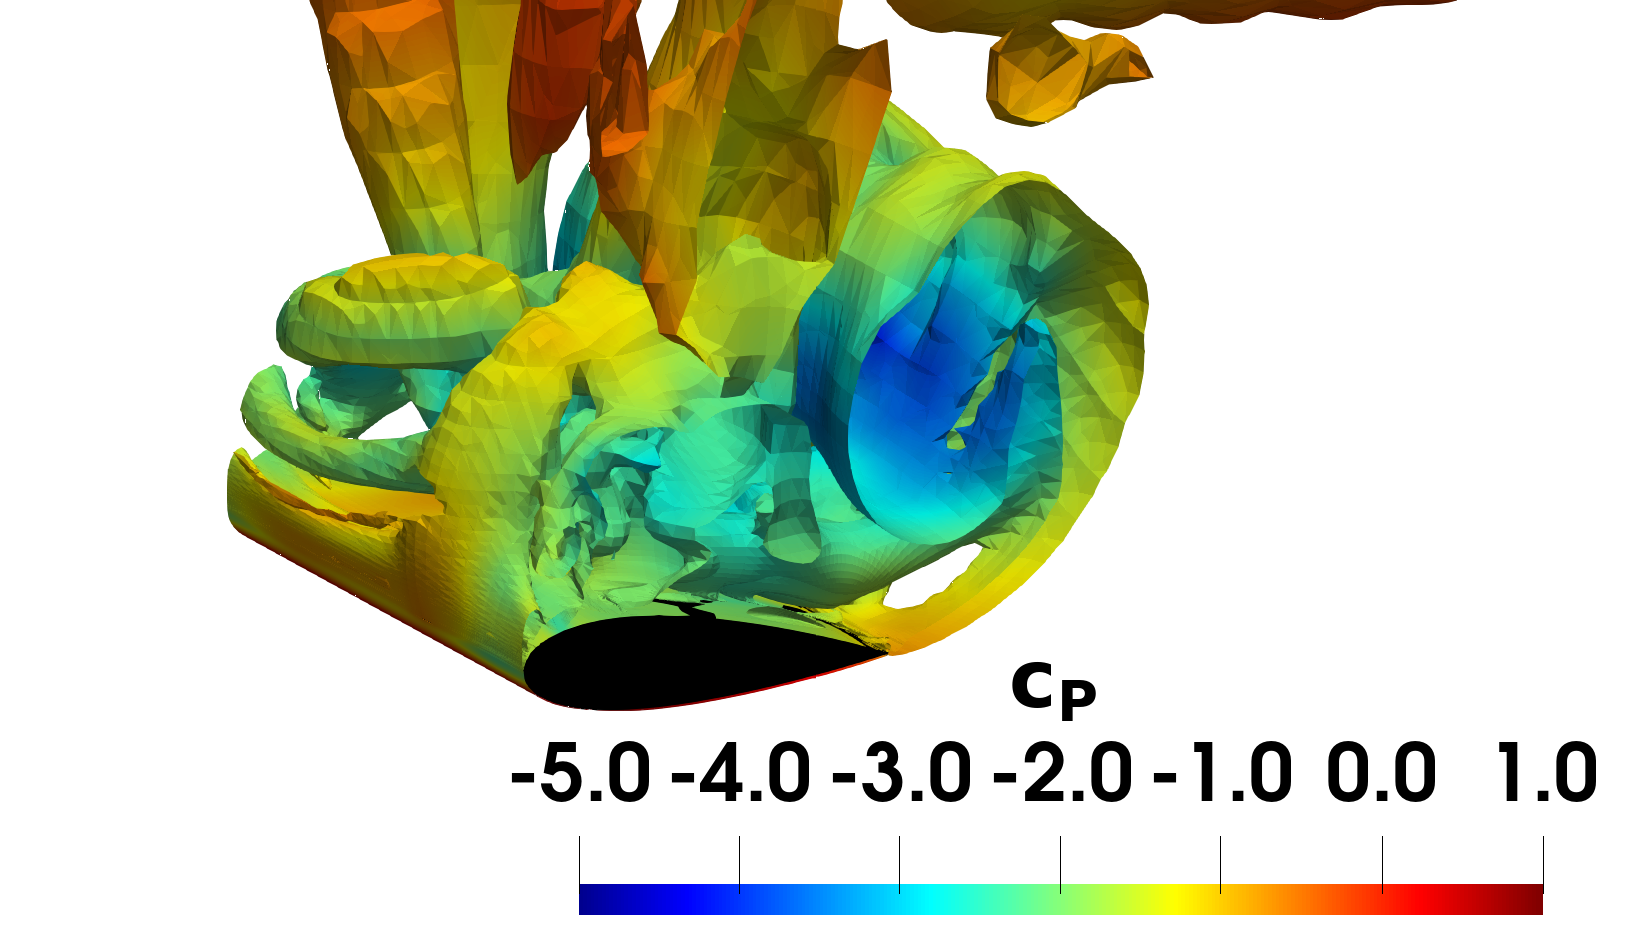
Figure 1 - Instantaneous vortical structures: iso-volume of the Q-criterion between 10⁻⁵ and 10⁻³, coloured by the pressure coefficient: SST-DDES (left) and SST-EDDES (right). With SST-DDES, the shear layer from the leading edge stays a smooth sheet before it rolls up. With SST-EDDES, it breaks up into small, three-dimensional eddies close to the airfoil.
Problem Setup
- Airfoil: NACA 0021, chord c = 1 m, angle of attack 60 degrees.
- Reynolds number based on the chord: 2.7 × 10⁵, as in the experiment of Swalwell et al.
- The experiment is at low Mach number, so the incompressible solver is used. Free-stream speed U = 4.1625 m/s, density 1.2 kg/m³, viscosity 1.85 × 10⁻⁵ Pa s.
- SST free stream: turbulence intensity 1.8% and eddy-to-laminar viscosity ratio 1, as in Guseva et al. (2017).
- SA free stream:
FREESTREAM_NU_FACTOR= 3, the ratio of the SA working variable to the kinematic viscosity. This is not an eddy-viscosity ratio; the SST ratio option has no effect with SA. - The span is periodic. All four runs use the same mesh, time step and flow discretization; the turbulence closures and their free-stream inputs differ as stated above.
Numerical settings:
- Time step 0.025 c/U with
DUAL_TIME_STEPPING-2ND_ORDERand 50 inner iterations per time step. Guseva et al. use 0.03 c/U. - Mean flow:
JSTcentral scheme. Turbulence: first-orderSCALAR_UPWIND. Green-Gauss gradients. - SA-DDES and both SST runs start from a steady RANS solution of the same turbulence model. SA-EDDES starts from the developed flow of an earlier SA-EDDES run.
- The first 100 c/U are left out of the statistics as start-up transient (20 c/U for SA-EDDES). All runs are then averaged over the same time, 520 c/U.
The configuration file contains the SST-EDDES settings; its header lists the changes for the other models. It now explicitly sets MAX_TIME= 481.0 so that the default 1-second limit cannot truncate the run. CONV_FIELD= RMS_PRESSURE names an available incompressible residual; CONV_STARTITER= 50 preserves the fixed 50 inner iterations of the reported runs. This iteration count is not evidence of sufficient inner convergence.
Case files and restart preparation
The mesh is available to the author; its public download location is pending review. Supply Mesh.cgns separately to run the configuration. The mesh description below identifies the grid used for the results.
You can generate the steady starting solution instead of downloading restart files:
- Copy the configuration to
naca0021_steady.cfgand use the same turbulence model as the intended unsteady run. SetHYBRID_RANSLES= NONE,TIME_DOMAIN= NOandRESTART_SOL= NO. - Remove
TIME_MARCHING,TIME_STEP,TIME_ITER,MAX_TIME,INNER_ITER,WINDOW_START_ITERandRESTART_ITERfrom that steady copy. SetITER= 10000as an initial iteration limit, then runSU2_CFD naca0021_steady.cfg. Check the residuals and forces and extend the solve if needed; reaching the limit does not establish convergence. - For second-order dual-time stepping with
RESTART_ITER= 2, supply two old time levels. After the steady solve has converged, copy its binary restart torestart_flow_00000.datandrestart_flow_00001.datin the unsteady run directory. These names followSOLUTION_FILENAME= restart_flow.dat. - Run
SU2_CFD naca0021_hybrid.cfgwithTIME_DOMAIN= YES,RESTART_SOL= YESandRESTART_ITER= 2. For later continuation, use the next step after an available saved pair, rather than resettingRESTART_ITERto 2. See Restart File.
The configuration sets WINDOW_START_ITER= 4005, approximately 100 c/U for its stated velocity and time step. This excludes the initial transient from SU2’s output averages, which continue until the run stops. The figures below instead use a fixed 520 c/U analysis window: 100–620 c/U for SA-DDES and the SST cases, and 20–540 c/U for the already-developed SA-EDDES run. A new SA-EDDES run from a steady RANS field must not automatically reuse the shorter 20 c/U exclusion; check its transient first. Changing the time step or restarting changes the appropriate window index.
Mesh Description
The mesh is a structured O-grid made of hexahedra:
- 162 points around the airfoil and 83 points from the wall to the far field, which is about 22 chords away.
- 31 points over a span of 1 chord, so the spanwise spacing is 0.033 c.
- 416,826 points and 398,520 hexahedra in total.
- The first cell at the wall gives y+ below 1 on average (95% of the wall points are below 1.4).
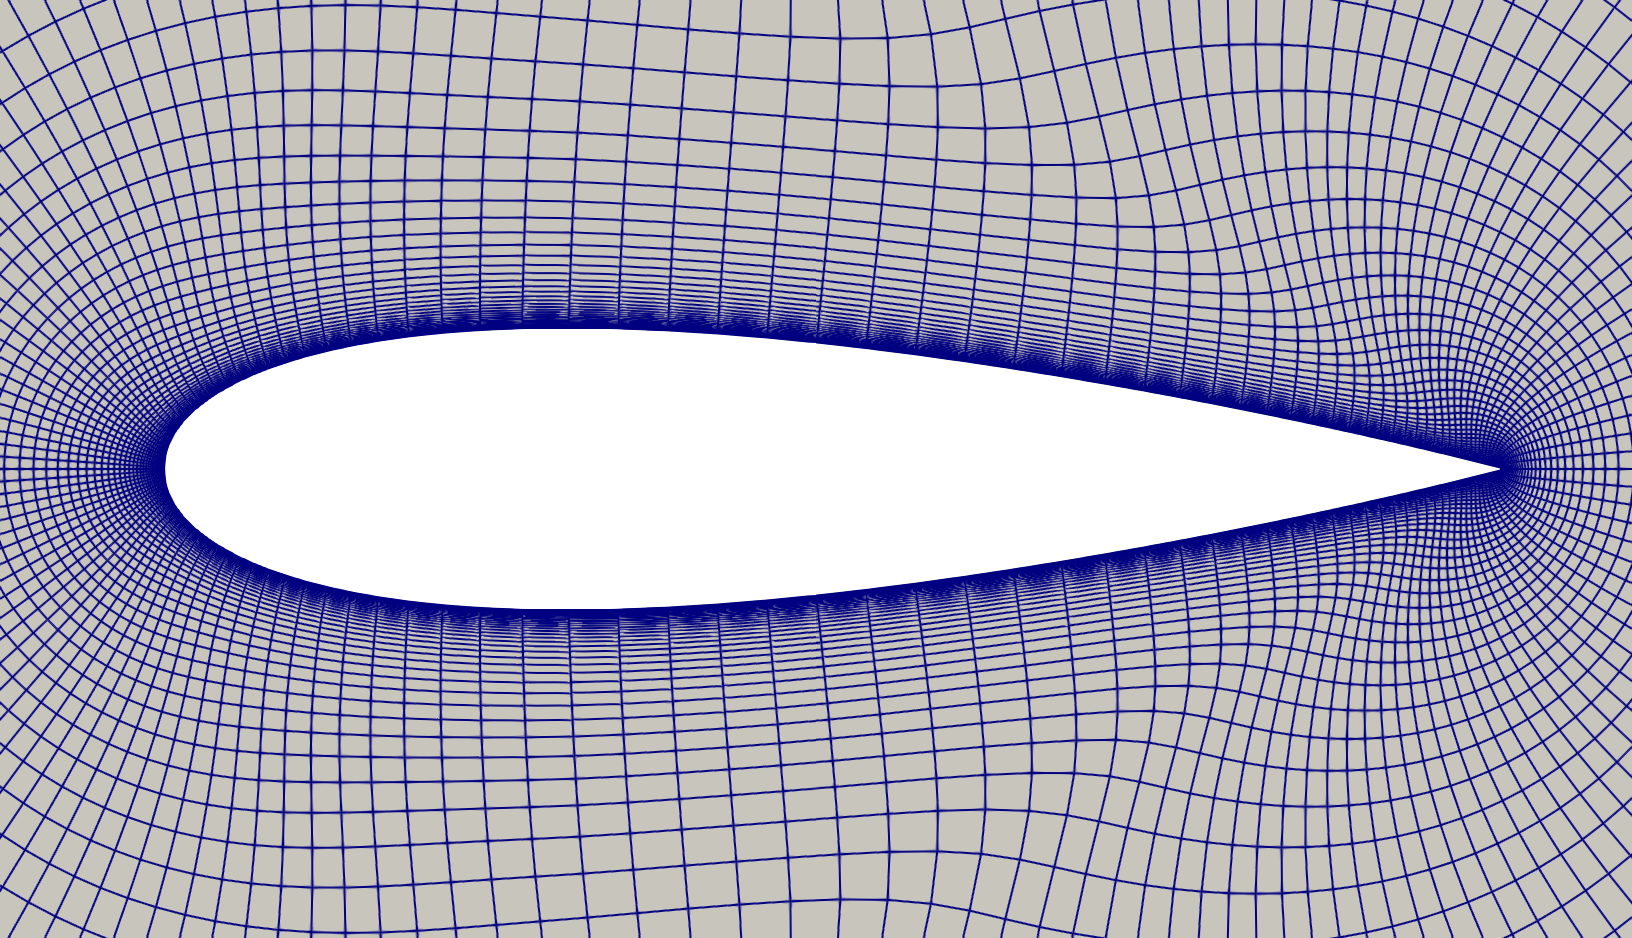
Figure 2 - Mesh near the airfoil, in a plane normal to the span.
The reference computations of Guseva et al. use a finer O-grid with a span of 4 chords. The span matters: with a span of 1 chord, DES gives higher mean forces, larger fluctuations and stronger suction than with 4 chords (Garbaruk et al. 2009). For this reason, this page compares the results with the published DES at a span of 1 chord, and with the experiment.
Results
Mean forces and pressure are averaged in time and along the span. The numerical results table provides the unrounded values behind the table below; T_stats is in c/U and the _se columns are standard errors of the mean. The force error bars and pressure bands use standard errors estimated from ten complete, non-overlapping blocks of 50 c/U; the remaining partial block is excluded from the error estimate. These estimates assume that the block means are sufficiently independent and the sampled flow is stationary. They are not bounds on mesh, time-step or turbulence-model error. Garbaruk et al. (2009) estimate that a span of 1 chord needs about 2400 c/U for a 1% error in the mean forces, so a few percent of statistical error remains here.
Mean forces
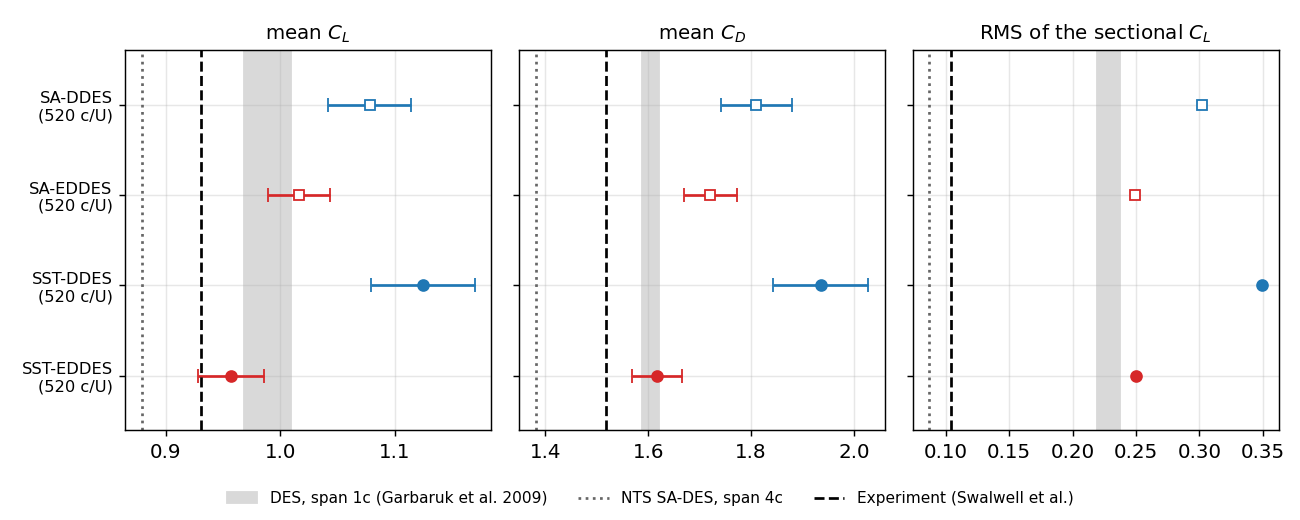
Figure 3 - Mean lift and drag coefficients (± 1 standard error) and RMS of the sectional lift fluctuations: the temporal standard deviation at each spanwise station, averaged along the span. Grey band: range of four published DES with a span of 1 chord (Garbaruk et al. 2009). Dotted line: NTS DES with a span of 4 chords. Dashed line: experiment of Swalwell et al.
| Run | Statistics (c/U) | Mean C_L | Mean C_D | RMS of sectional C_L fluctuations | Shedding Strouhal number |
|---|---|---|---|---|---|
| SA-DDES | 520 | 1.08 ± 0.04 | 1.81 ± 0.07 | 0.30 | 0.18 |
| SA-EDDES | 520 | 1.02 ± 0.03 | 1.72 ± 0.05 | 0.25 | 0.19 |
| SST-DDES | 520 | 1.12 ± 0.05 | 1.94 ± 0.09 | 0.35 | 0.17 |
| SST-EDDES | 520 | 0.96 ± 0.03 | 1.62 ± 0.05 | 0.25 | 0.19 |
| DES, span 1 c (Garbaruk et al. 2009) | 1000 – 2100 | 0.97 – 1.01 | 1.59 – 1.62 | 0.22 – 0.24 | about 0.2 |
| Experiment (Swalwell et al.) | 8860 | 0.93 | 1.52 | 0.10 | 0.20 |
- SST-EDDES drag lies inside the published range for the same span; SA-EDDES drag is about 6–8% above that range.
- The two DDES runs give 7 to 22% more lift and drag than the published DES, and larger fluctuations. For SST, the difference is about three combined standard errors, using the square root of the sum of the two squared error estimates. This comparison assumes independent runs and does not test the adequacy of the block length.
- All runs give more lift and drag than the experiment. The published span study shows the same direction of change, so the narrow span is a plausible contributor. Its contribution cannot be separated here from numerical and model differences.
Mean pressure coefficient
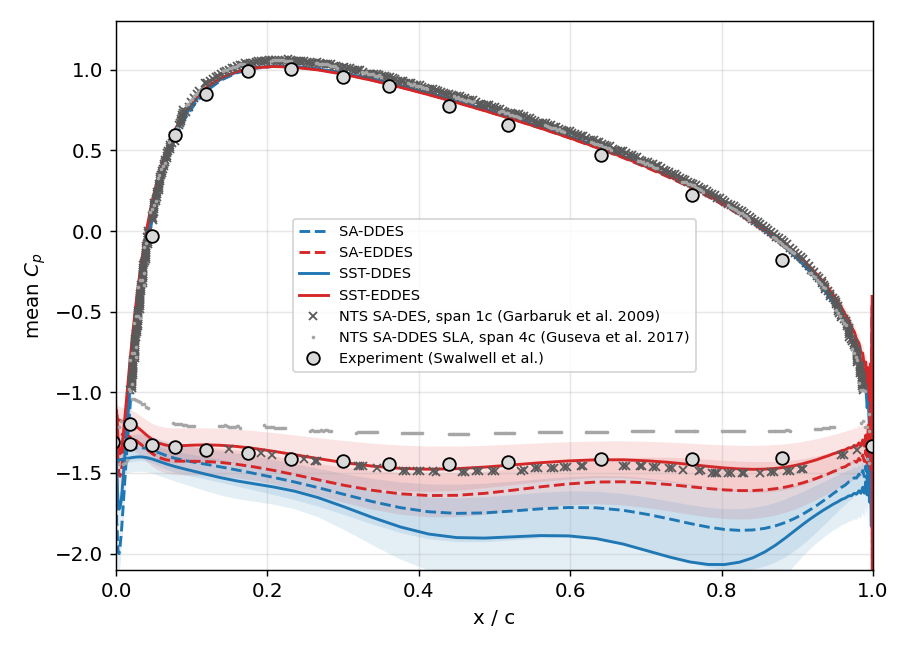
Figure 4 - Mean pressure coefficient. The bands show ± 2 standard errors. Crosses: NTS SA-DES with a span of 1 chord (Garbaruk et al. 2009). Grey dots: NTS SA-DDES with the shear-layer-adapted cell size and a span of 4 chords (Guseva et al. 2017).
- On the pressure side, all models agree with the experiment and with each other.
- On the suction side, SST-EDDES follows the experiment and the published DES at 1 chord. SA-EDDES has a little more suction.
- Both DDES runs have clearly more suction than the experiment. This matches their higher drag.
- The DES at 4 chords has less suction than the experiment. This shows again how much the span changes the result.
Lift spectrum
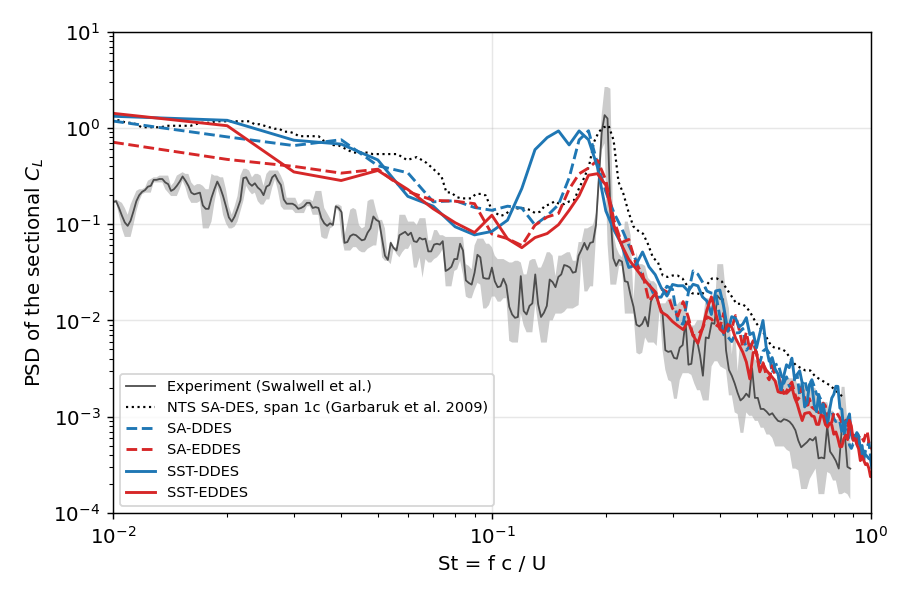
Figure 5 - Power spectral density (PSD) of the sectional lift coefficient, averaged along the span, against the Strouhal number St = f c / U. Welch method with segments of 100 c/U. Experiment and NTS DES digitized from Guseva et al. (2017) and Garbaruk et al. (2009). The scaling of the published curves is not stated, so compare the shapes and the peak positions.
- All runs show the vortex-shedding peak. The EDDES runs put it at St = 0.19, close to the experiment (0.198).
- SST-DDES puts the peak at St = 0.17, with more energy at low frequency. This suggests stronger and more regular shedding, closer to a two-dimensional flow.
- Above St = 0.25, all runs follow the slope of the experiment.
Summary
- All four hybrid models run on this massively separated flow and give the shedding frequency of the experiment within 15%.
- With either background model, the shear-layer-adapted cell size (EDDES) moves the results toward the experiment and toward the published DES at the same span. With the longest-edge cell size (DDES), the shear layers stay smooth for longer, and the forces are too high.
- The SA and SST versions of the same variant give similar results.
Limits of this study
- One mesh, with a span of 1 chord. The published reference uses 4 chords. A run with a span of 4 chords has been started.
- The
JSTscheme without a low-dissipation option damps the small eddies more than the schemes of the reference computations. - There is no mesh-refinement, time-step-refinement or inner-iteration sensitivity study in this comparison. Agreement with a reference on one mesh does not establish numerical convergence.
- The table and figures summarize the existing runs; the configuration and restart instructions are starting points for reproduction, not a newly repeated CFD campaign.
- The statistics cover 520 c/U for each run. The mean forces still have a statistical error of 3 to 5%. The SST runs were continued further (to about 1000 c/U): over the longer time, their mean forces change by less than 0.02, within this error.
- The published DES at a span of 1 chord average over 1000 to 2100 c/U (Garbaruk et al. 2009, Table 2), 2 to 4 times longer than here. With their error estimate (their Eq. 1), our 520 c/U give an error of about 2 to 3% in the mean forces, close to our own estimate.
References
- Swalwell, K. E., Sheridan, J., Melbourne, W. H., “Frequency analysis of surface pressures on an airfoil after stall”, 21st AIAA Applied Aerodynamics Conference, AIAA Paper 2003-3416, 2003.
- Garbaruk, A., Leicher, S., Mockett, C., Spalart, P., Strelets, M., Thiele, F., “Evaluation of time sample and span size effects in DES of nominally 2D airfoils beyond stall”, in Progress in Hybrid RANS-LES Modelling, NNFM 111, Springer, 2010. Author copy
- Guseva, E. K., Garbaruk, A. V., Strelets, M. Kh., “Assessment of Delayed DES and Improved Delayed DES combined with a shear-layer-adapted subgrid length-scale in separated flows”, Flow Turbul. Combust. 98, 481–502, 2017.
- Shur, M. L., Spalart, P. R., Strelets, M. Kh., Travin, A. K., “An enhanced version of DES with rapid transition from RANS to LES in separated flows”, Flow Turbul. Combust. 95, 709–737, 2015. doi:10.1007/s10494-015-9618-0
- Gritskevich, M. S., Garbaruk, A. V., Schütze, J., Menter, F. R., “Development of DDES and IDDES formulations for the k-ω shear stress transport model”, Flow Turbul. Combust. 88, 431–449, 2012. doi:10.1007/s10494-011-9378-4