-
Inviscid Bump in a Channel
Inviscid Supersonic Wedge
Inviscid ONERA M6
Laminar Flat Plate
Laminar Cylinder
Turbulent Flat Plate
Transitional Flat Plate
Transitional Flat Plate for T3A and T3A-
Turbulent ONERA M6
Unsteady NACA0012
Epistemic Uncertainty Quantification of RANS predictions of NACA 0012 airfoil
Non-ideal compressible flow in a supersonic nozzle
Non-ideal compressible flows with physics-informed neural networks
Aachen turbine stage with Mixing-plane
-
Inviscid Hydrofoil
Laminar Flat Plate with Heat Transfer
Turbulent Flat Plate
Turbulent NACA 0012
Laminar Backward-facing Step
Laminar Buoyancy-driven Cavity
Streamwise Periodic Flow
Species Transport
Composition-Dependent model for Species Transport equations
Unsteady von Karman vortex shedding
Turbulent Bend with wall functions
Wind velocity and pollutant dispersion in a city
-
Static Fluid-Structure Interaction (FSI)
Dynamic Fluid-Structure Interaction (FSI) using the Python wrapper and a Nastran structural model
Static Conjugate Heat Transfer (CHT)
Unsteady Conjugate Heat Transfer
Solid-to-Solid Conjugate Heat Transfer with Contact Resistance
Incompressible, Laminar counterflow diffusion flame
Incompressible, Laminar Combustion Simulation
User Defined combustion model with Python
-
Unconstrained shape design of a transonic inviscid airfoil at a cte. AoA
Constrained shape design of a transonic turbulent airfoil at a cte. CL
Constrained shape design of a transonic inviscid wing at a cte. CL
Shape Design With Multiple Objectives and Penalty Functions
Unsteady Shape Optimization NACA0012
Unconstrained shape design of a two way mixing channel
Adjoint design optimization of a turbulent 3D pipe bend
Realtime update of residuals and solution in paraview
| Written by | for Version | Revised by | Revision date | Revised version |
|---|---|---|---|---|
| @Nijso Beishuizen | 7.5.0 | @ |
Solver: |
|
Uses: |
|
Prerequisites: |
None |
Complexity: |
Introduction
Often we want to view the solution residuals to see if the solution converges. If the residuals seem to stall or oscillate, this might be an indication that the setup is incorrect. A setting has to be changed or the mesh quality has to be improved to ensure convergence. Sometimes this stalling behavior is temporary, and a look at an intermediate paraview solution can lead to more insight. The intermediate solution can also show if the solution is converging towards the expected solution. In this tutorial we will briefly discuss a paraview setup that will give a live update of the residuals as well as the paraview solution.
SU2 Configuration file
We will first discuss some SU2 options that affect our workflow.
The residuals are saved in the history file. The filename is given by the keyword CONV_FILENAME= history. Its contents are determined by the keyword HISTORY_OUTPUT. We usually store the RMS values of the residuals with the number of iterations, so we set HISTORY_OUTPUT= ITER RMS_RES. The file can be saved either in tecplot format or as comma separated values (csv). We use the csv file format because it is very easy to read in paraview. This is the default but can be set explicitly with the keyword TABULAR_FORMAT= CSV. The filename will now be called history.csv . The paraview solution is written every x iterations in the filename given by VOLUME_FILENAME and x depends on the value of OUTPUT_WRT_FREQ. You can save a (2D or 3D) paraview solution using either OUTPUT_FILES= PARAVIEW with the extension (suffix) .vtu or OUTPUT_FILES= PARAVIEW_MULTIBLOCK with extension .vtm. To summarize, the following settings are recommended for the paraview live update:
TABULAR_FORMAT= CSV
CONV_FILENAME= history
OUTPUT_FILES= RESTART, PARAVIEW, PARAVIEW_MULTIBLOCK
OUTPUT_WRT_FREQ= 100, 10, 10
VOLUME_FILENAME= flow
VOLUME_OUTPUT= RESIDUAL, PRIMITIVE, SOLUTION
HISTORY_OUTPUT= ITER, RMS_RES
Paraview setup
The paraview live update will simply reload the contents of these files every x seconds, where x is a user defined value. If you haven’t installed paraview yet, you can download the latest version here:
We open paraview and add a new source. Choose Live Programmable Source.
Then choose the Output Data Set Type from the list. If you save a regular paraview file, the output filename ends with .vtu. Then choose vtkUnstructuredGrid. If you save a multiblock paraview file that has the extension .vtm, then choose vtkMultiBlockDataSet.
In the Script section, copy the following python script:
# .vtu paraview
from paraview.vtk.vtkIOXML import vtkXMLUnstructuredGridReader as vtuReader
reader = vtuReader()
reader.SetFileName('flow.vtu')
reader.Update()
self.GetOutputDataObject(0).ShallowCopy(reader.GetOutput())
or for a multiblock paraview file:
# .vtm multiblock
from paraview.vtk.vtkIOXML import vtkXMLMultiBlockDataReader as vtmreader
vtmreader = vtmreader()
vtmreader.SetFileName('flow.vtm')
vtmreader.Update()
self.GetOutputDataObject(0).ShallowCopy(vtmreader.GetOutput())
The only thing you need to change here is the filename. Note that this script assumes that you have started paraview in the directory where the paraview filename can be found. The section Script (RequestInformation) can be left empty. In the next section, called Script (CheckNeedsUpdate), write the following:
import time
# the update frequency is 30 seconds
UpdateFrequency = 30
if not hasattr(self, "_my_time"):
  setattr(self, "_my_time", time.time())

t = time.time()
lastTime = getattr(self, "_my_time")

if t - lastTime > UpdateFrequency:
  setattr(self, "_my_time", t)
  self.SetNeedsUpdate(True)
And that’s it! You now have a paraview viewer that automatically reads the paraview solution file every 30 seconds! Below the script section you can choose as coloring one of the solution fields, as with a regular paraview session.
You can create a similar setup for the history file to view the residuals. We therefore create a second Live Programmable Source. We can keep the CheckNeedsUpdate block the same, but since this file gets updated every iteration, we can change the frequency to a lower value, for instance 5 seconds. To load the history file, we set the Output Data Set Type to vtkTable and add the following code to the Script block:
import numpy as np
import pandas as pd

data = pd.read_csv("history.csv",sep=',')
print(data.keys())
print(len(data.columns))
for name in data.keys():
  array = data[name].to_numpy()
  output.RowData.append(array, name)
If you now create 2 RenderView windows next to each other (either use Split Horizontal axis or use Split Vertical Axis) you can visualize the contour in one window and the residuals in the second window. Make sure that when you create the viewing window for the line plot, it is set to Line Chart View. The contour plot window uses the default Render View. You can now select the residuals from the Series Parameters list.
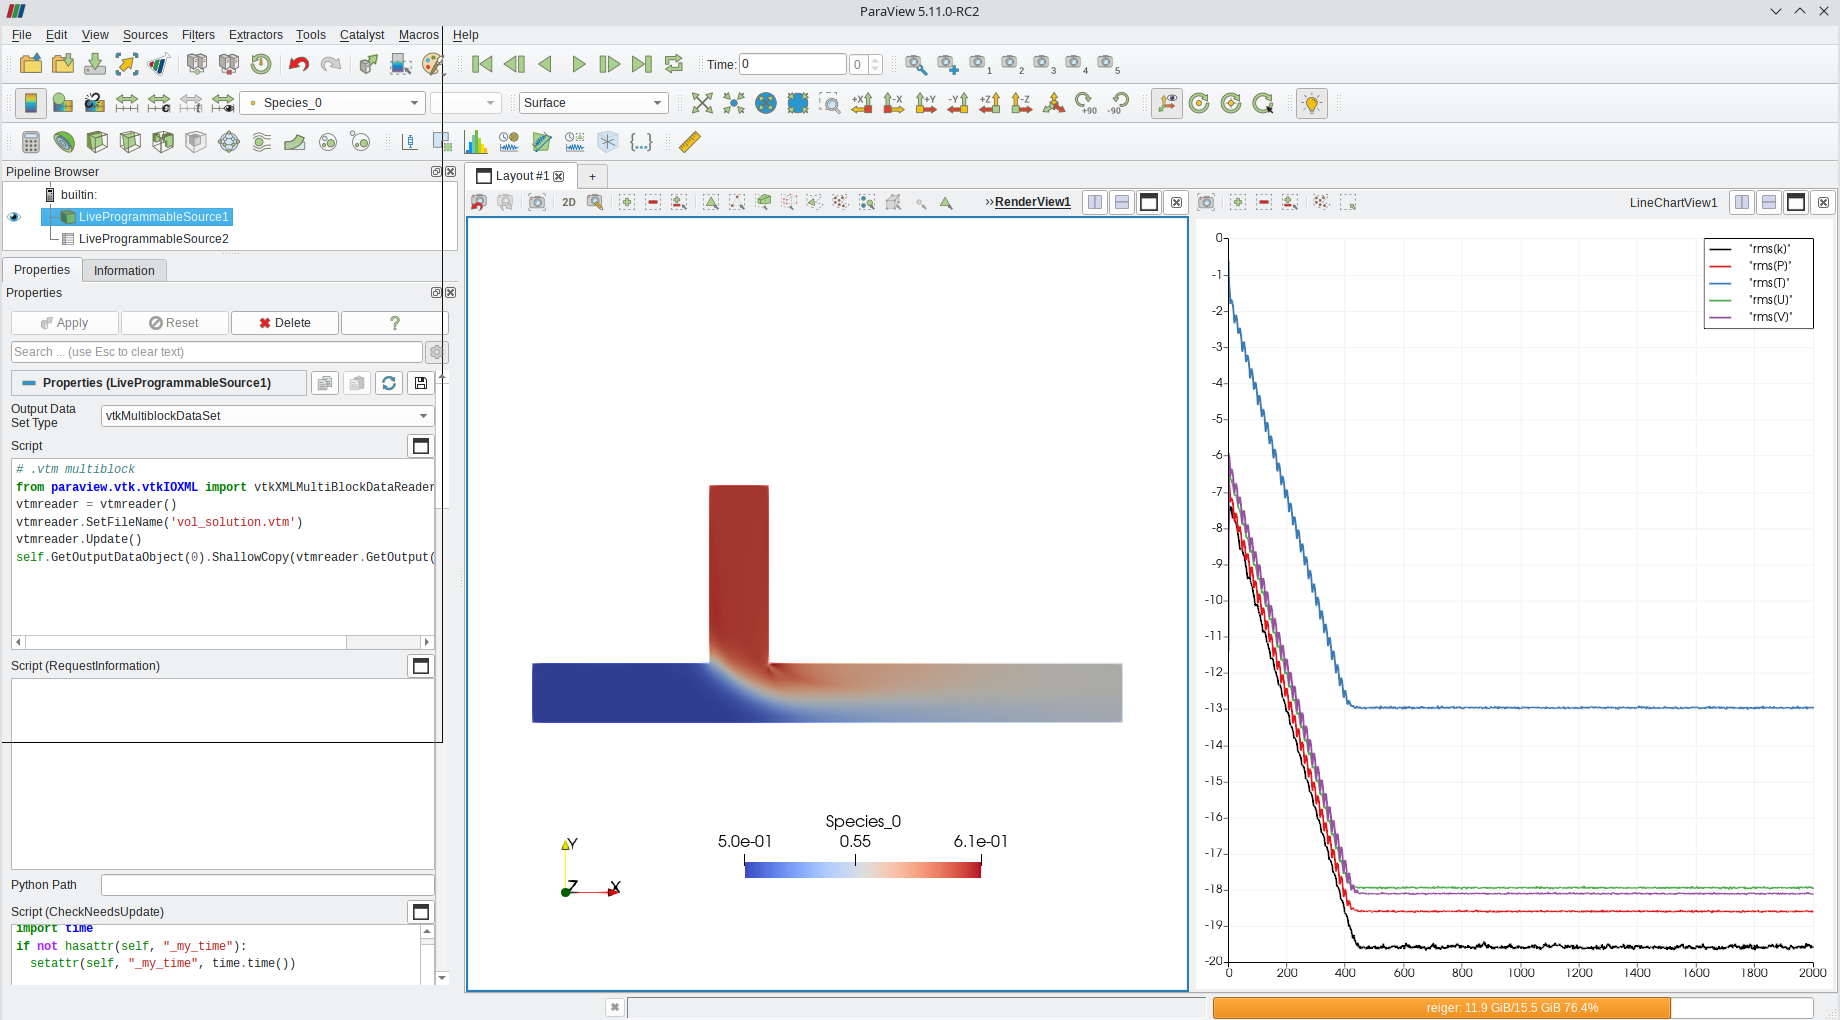 Figure (1): screenshot of the paraview live setup.